
Table of Contents
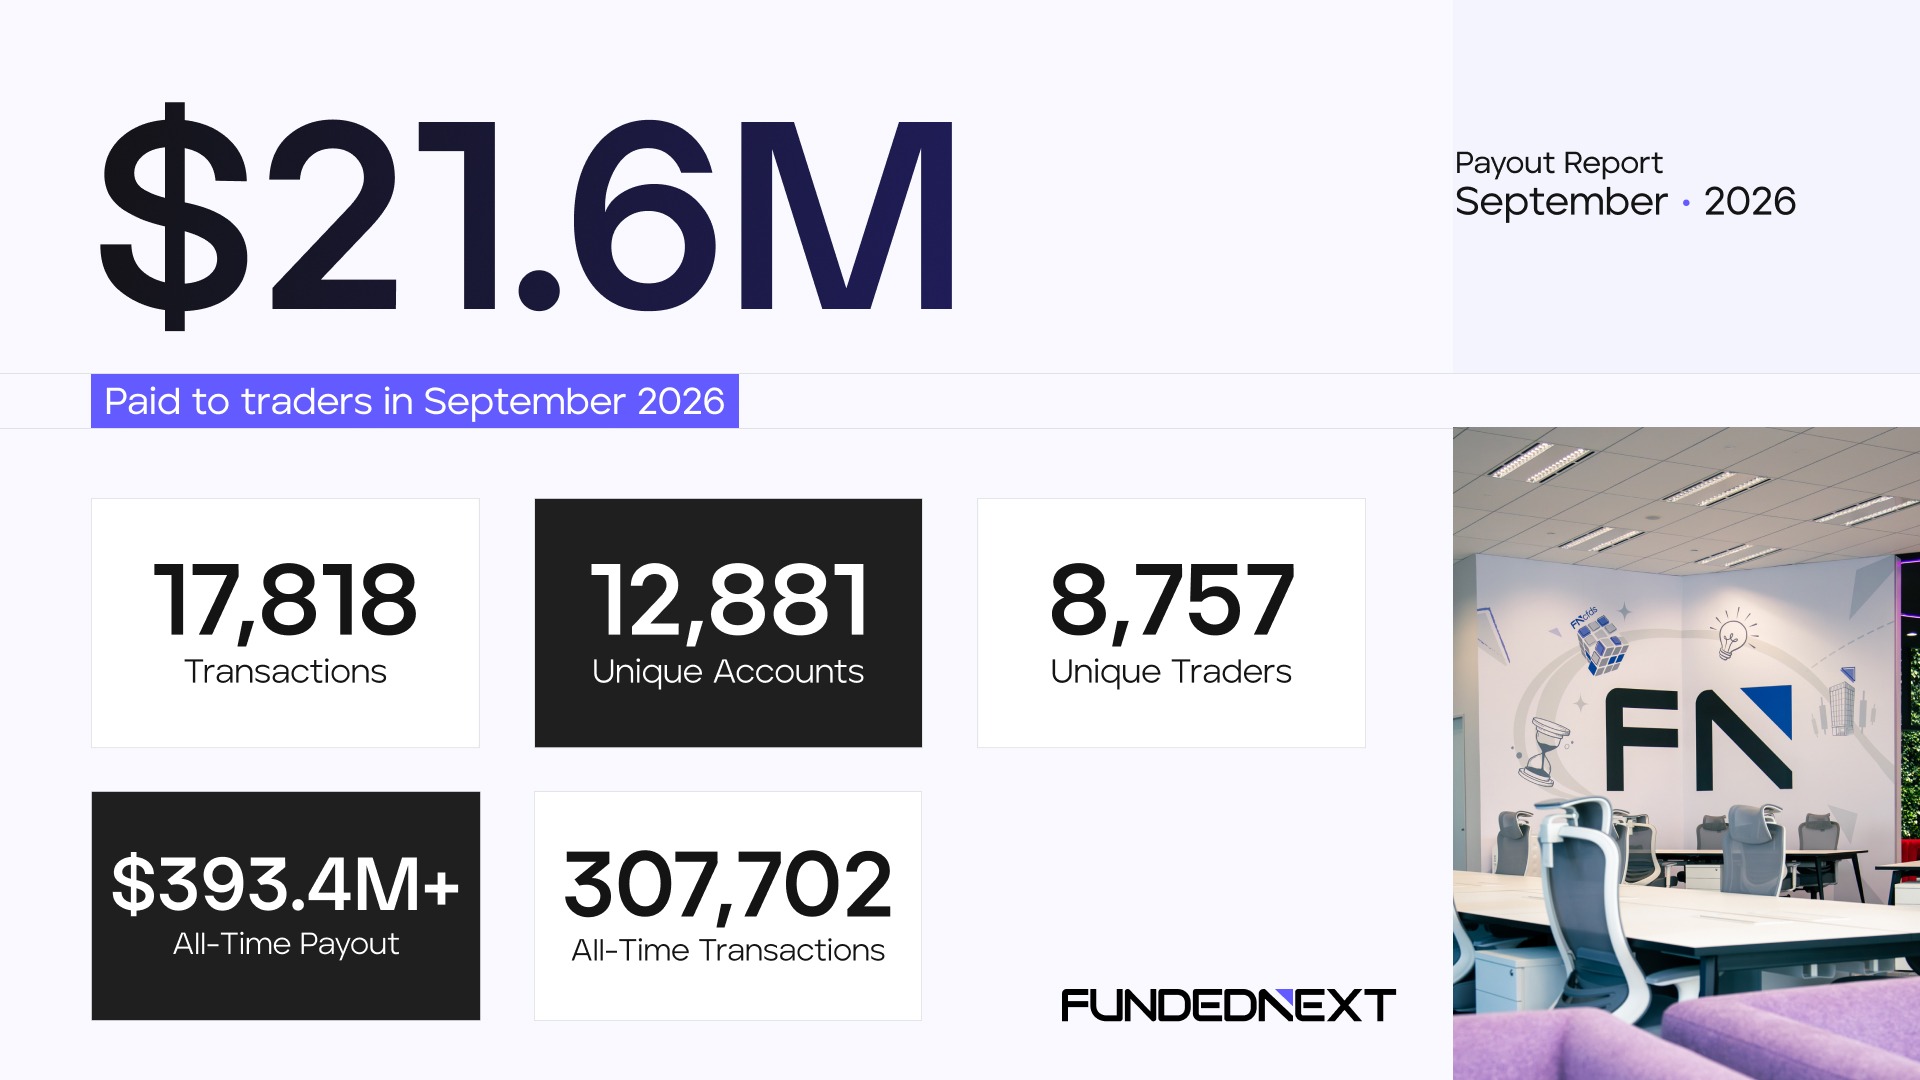
FundedNext paid $21.6M to 8,757 traders in September 2026.
A payout total shows how much was paid. It does not show how long each payout took, how large it was, or how many traders were paid more than once. This report covers all three, for every payout processed in September.
September by the Numbers
FundedNext processed 17,818 payout transactions in September. They went to 12,881 unique accounts and 8,757 unique traders.
The account count is higher than the trader count because some traders hold more than one funded account. Transactions measure the volume processed. Traders measure how many people were paid.
| Metric | September 2026 |
| Total disbursed | $21.6M |
| Payout transactions | 17,818 |
| Unique accounts | 12,881 |
| Unique traders | 8,757 |
| All-time payouts | $393.4M+ |
| All-time payout transactions | 307,702 |
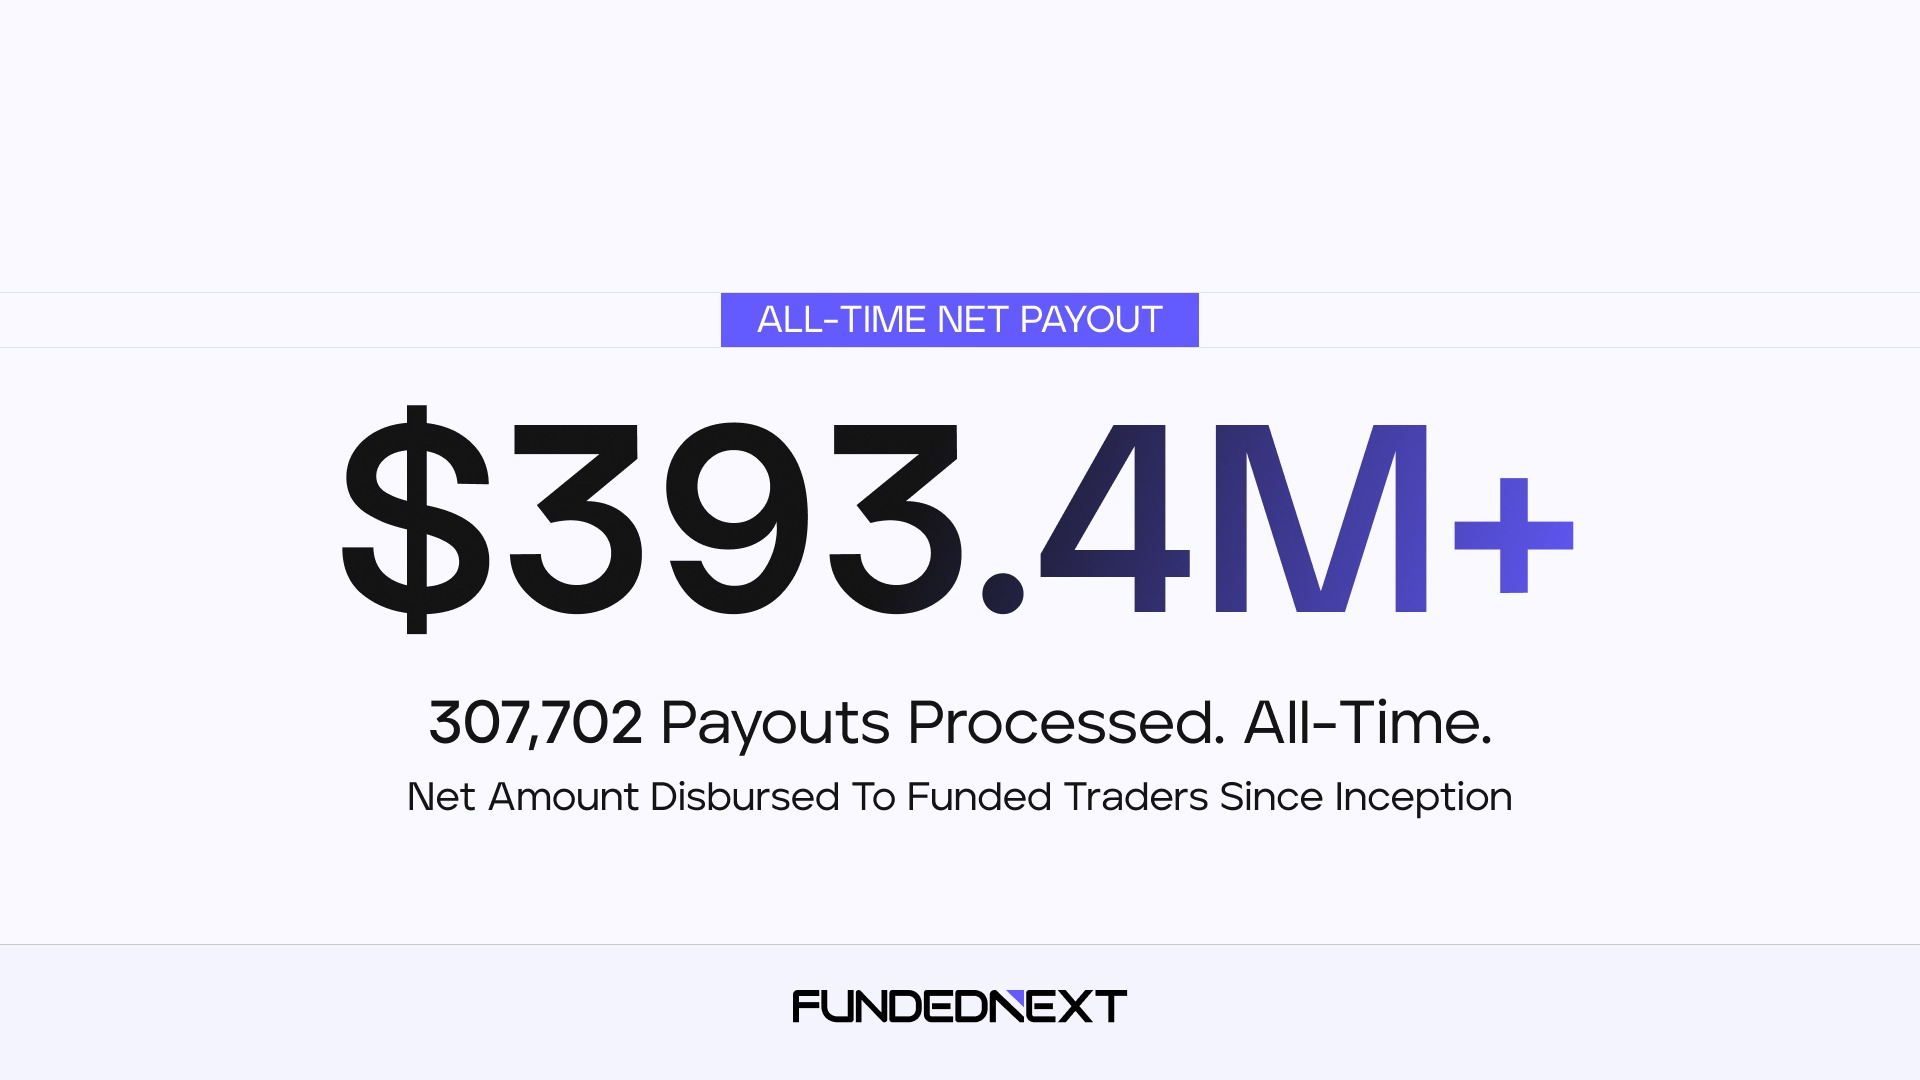
Since inception, FundedNext has processed 307,702 payout transactions totaling $393.4M+.
Processing Time
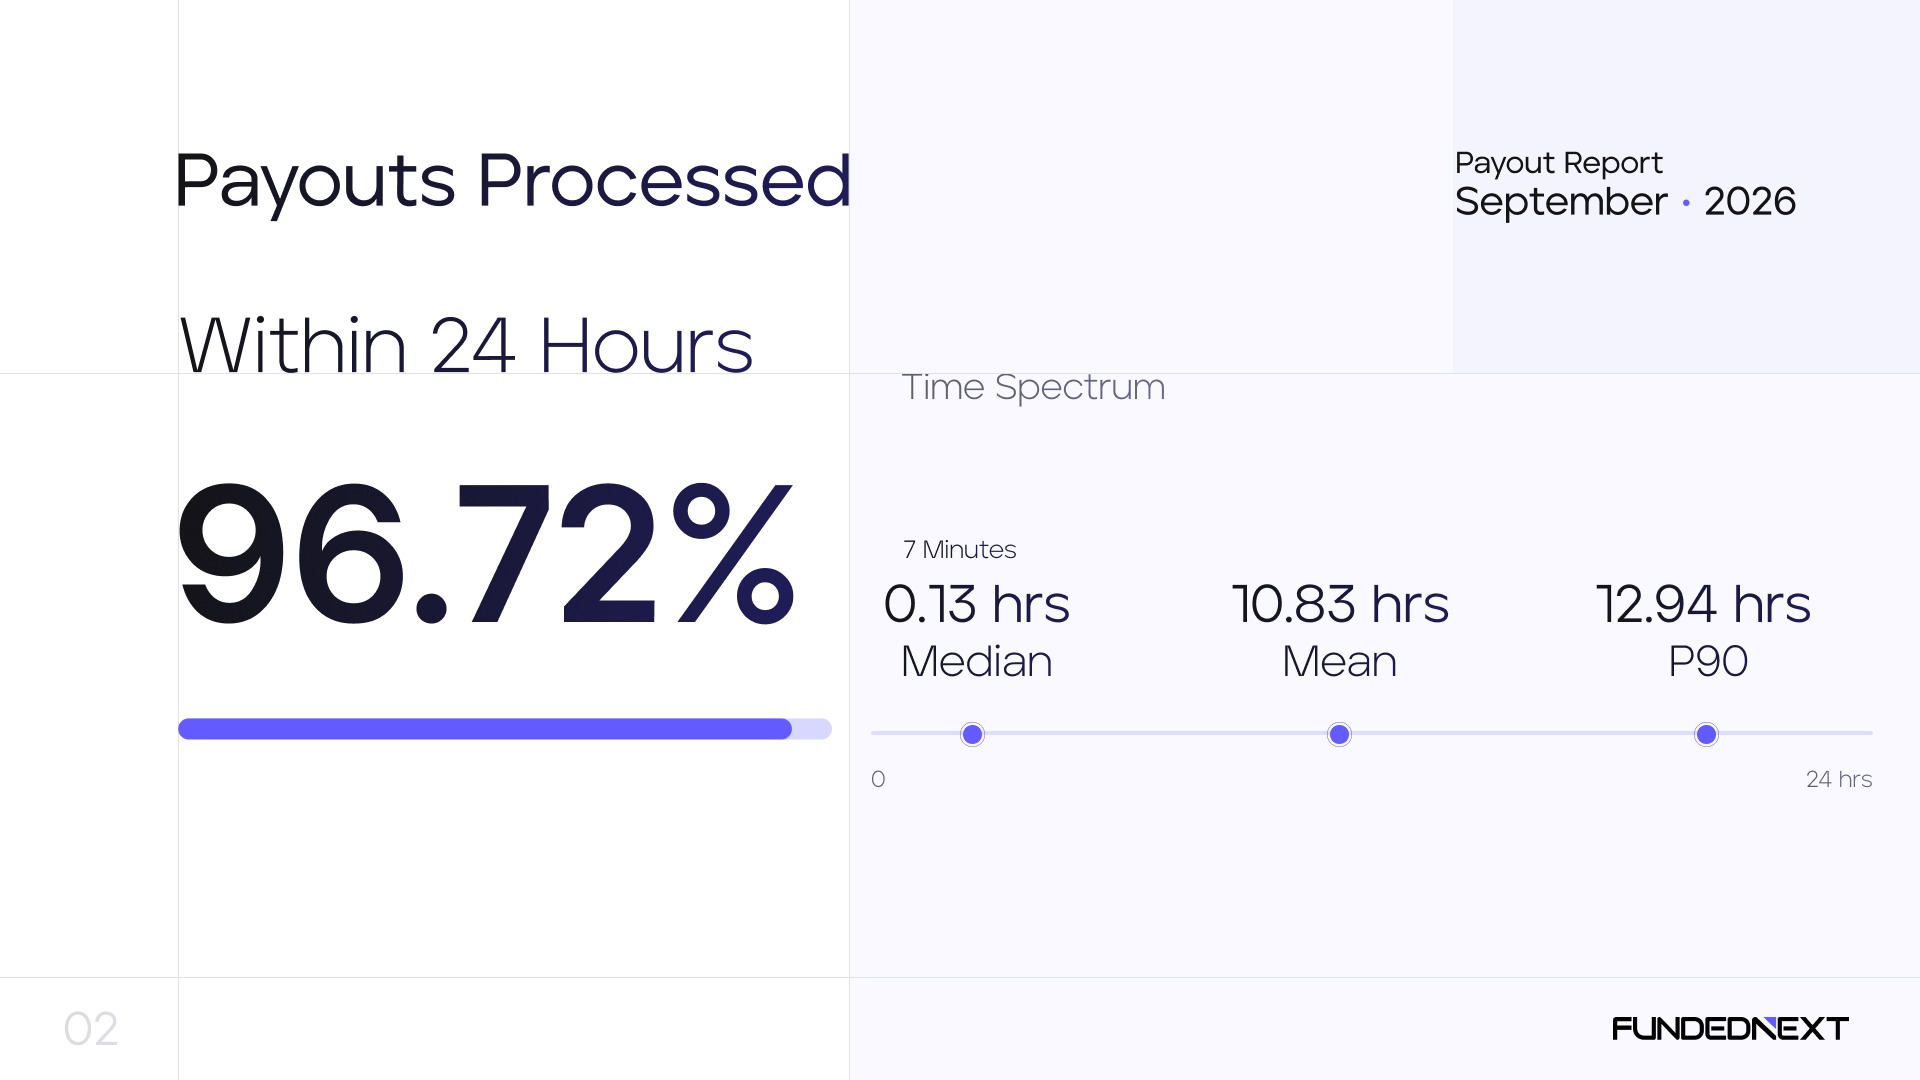
The median payout in September took 7 minutes to process, meaning half of all payouts were faster and half took longer. The mean was 10.8 hours, and the 90th percentile was 12.9 hours. 96.72% of payouts were processed within 24 hours.
The mean sits above the median because the distribution has a long right tail: a small number of slow payouts pull the average up. 585 payouts (3.3%) took longer than 24 hours. The report shows that figure next to the median so the full range is visible.
The image below splits all 17,818 payouts by processing time.
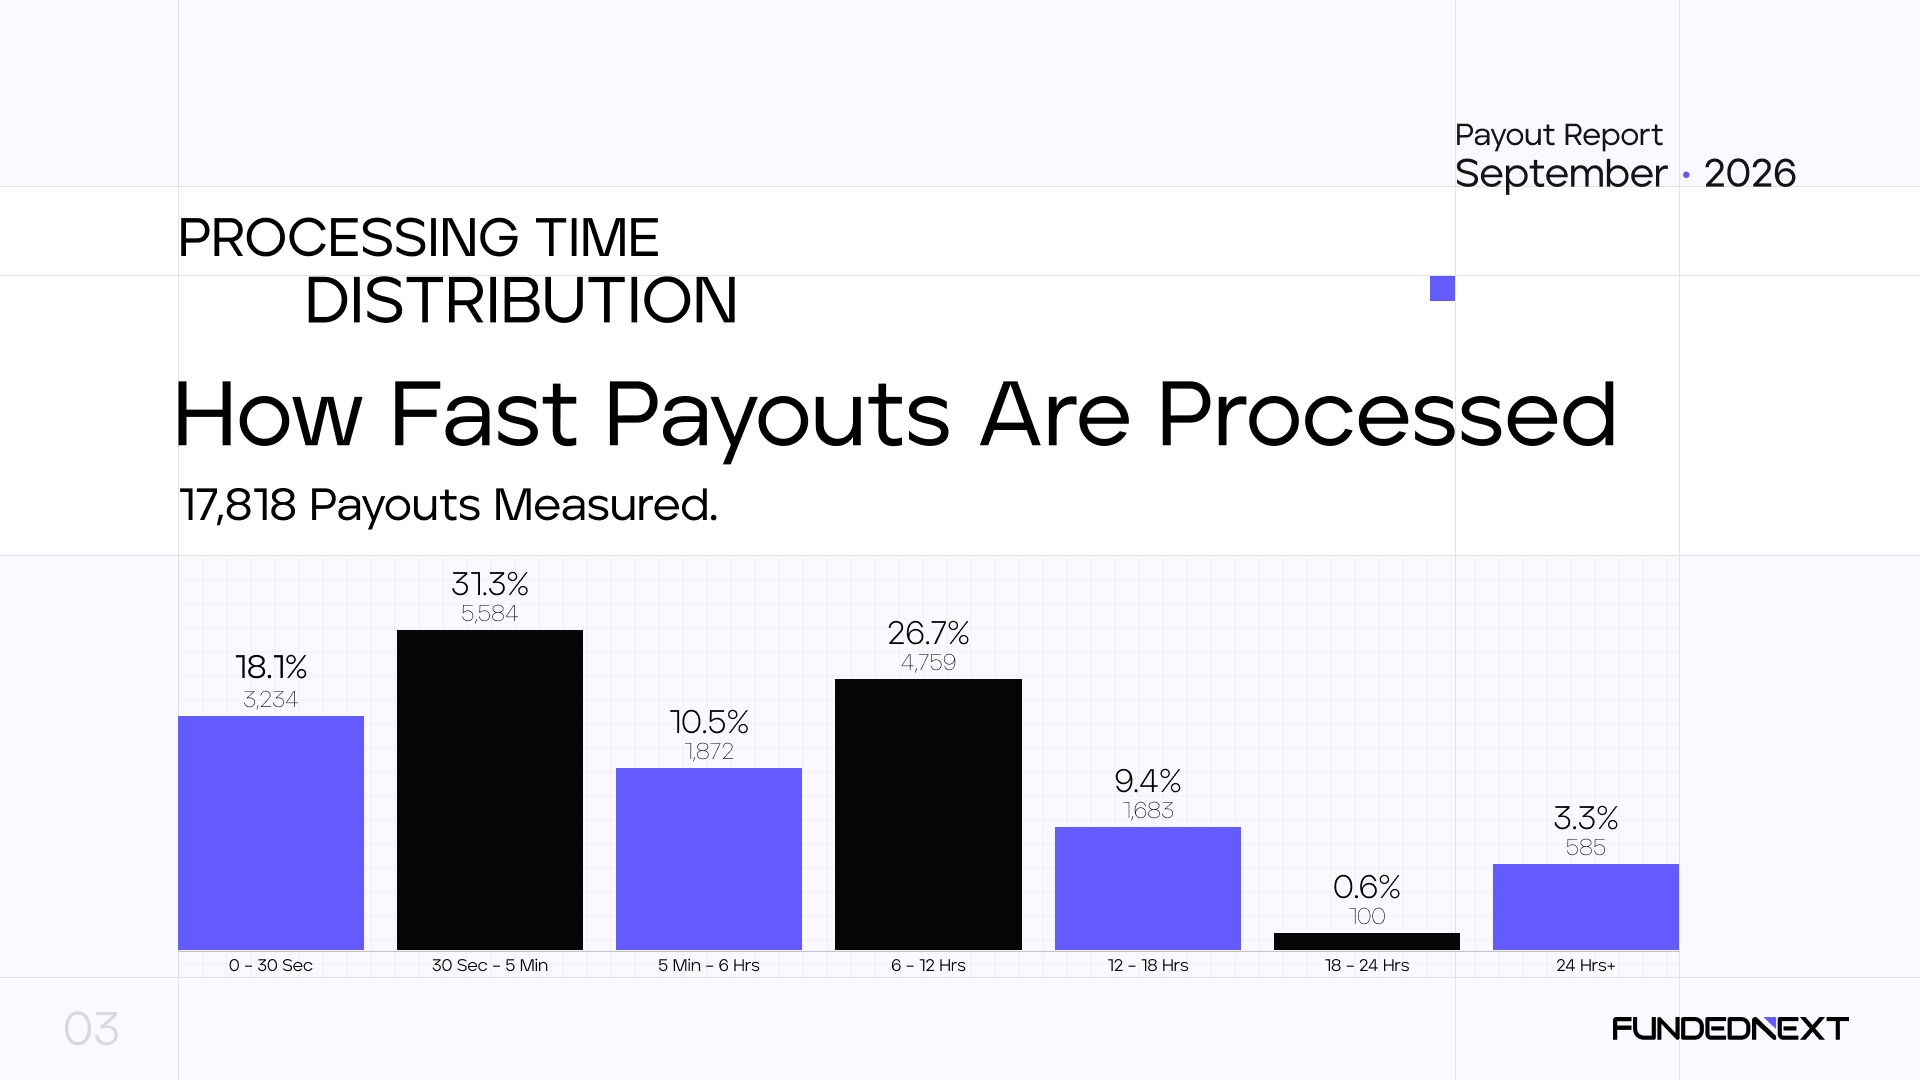
8,818 payouts, nearly half of the month, finished in under 5 minutes. A second cluster sits in the 6-to-12-hour window: 4,759 payouts, 26.7%.
Payout Sizes
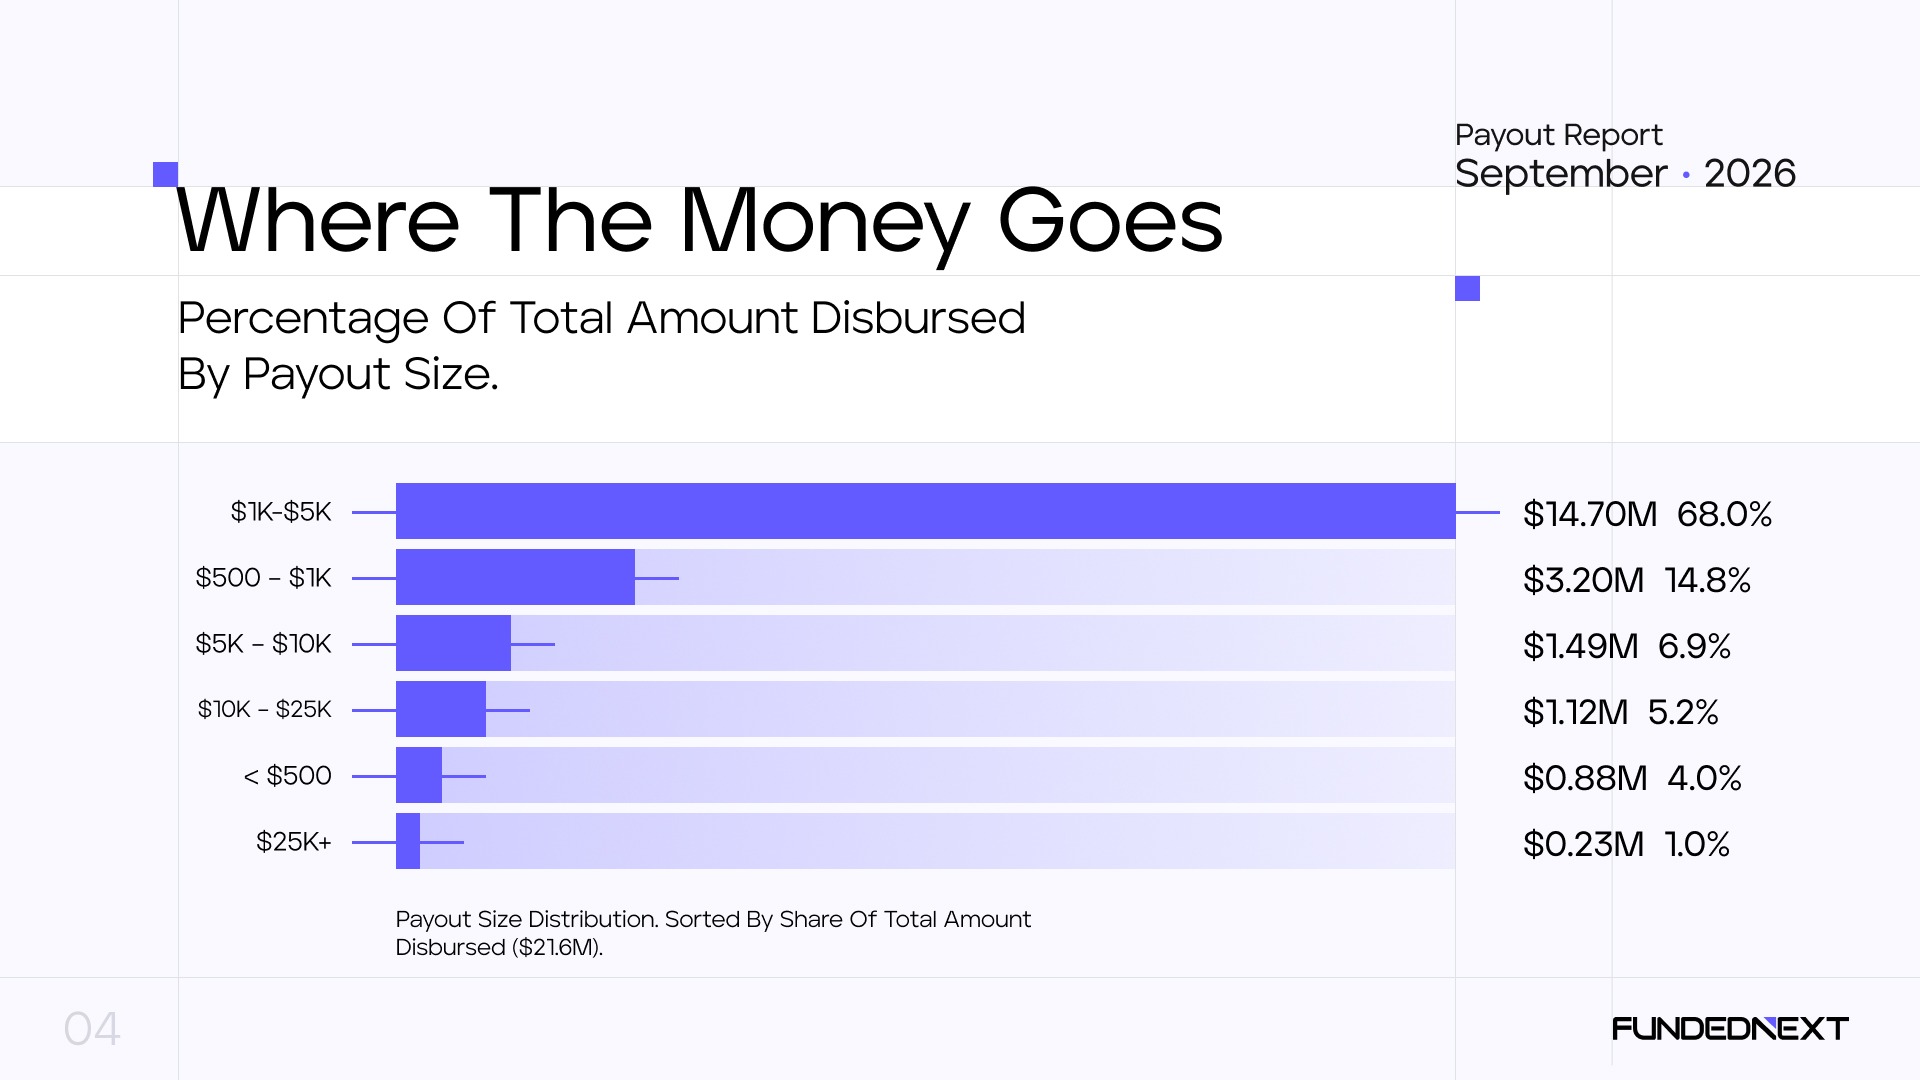
Payouts between $1K and $5K carried the month: $14.70M, or 68.0% of the amount disbursed.
| Payout size | Amount disbursed | Share |
| Under $500 | $0.88M | 4.0% |
| $500 to $1K | $3.20M | 14.8% |
| $1K to $5K | $14.70M | 68.0% |
| $5K to $10K | $1.49M | 6.9% |
| $10K to $25K | $1.12M | 5.2% |
| $25K and above | $0.23M | 1.0% |
Payouts under $5K made up about 87% of the amount. Payouts of $25K and above totaled $0.23M. The average payout was about $1,212, which is the total disbursed divided by the 17,818 transactions.
Payout Frequency: Accounts
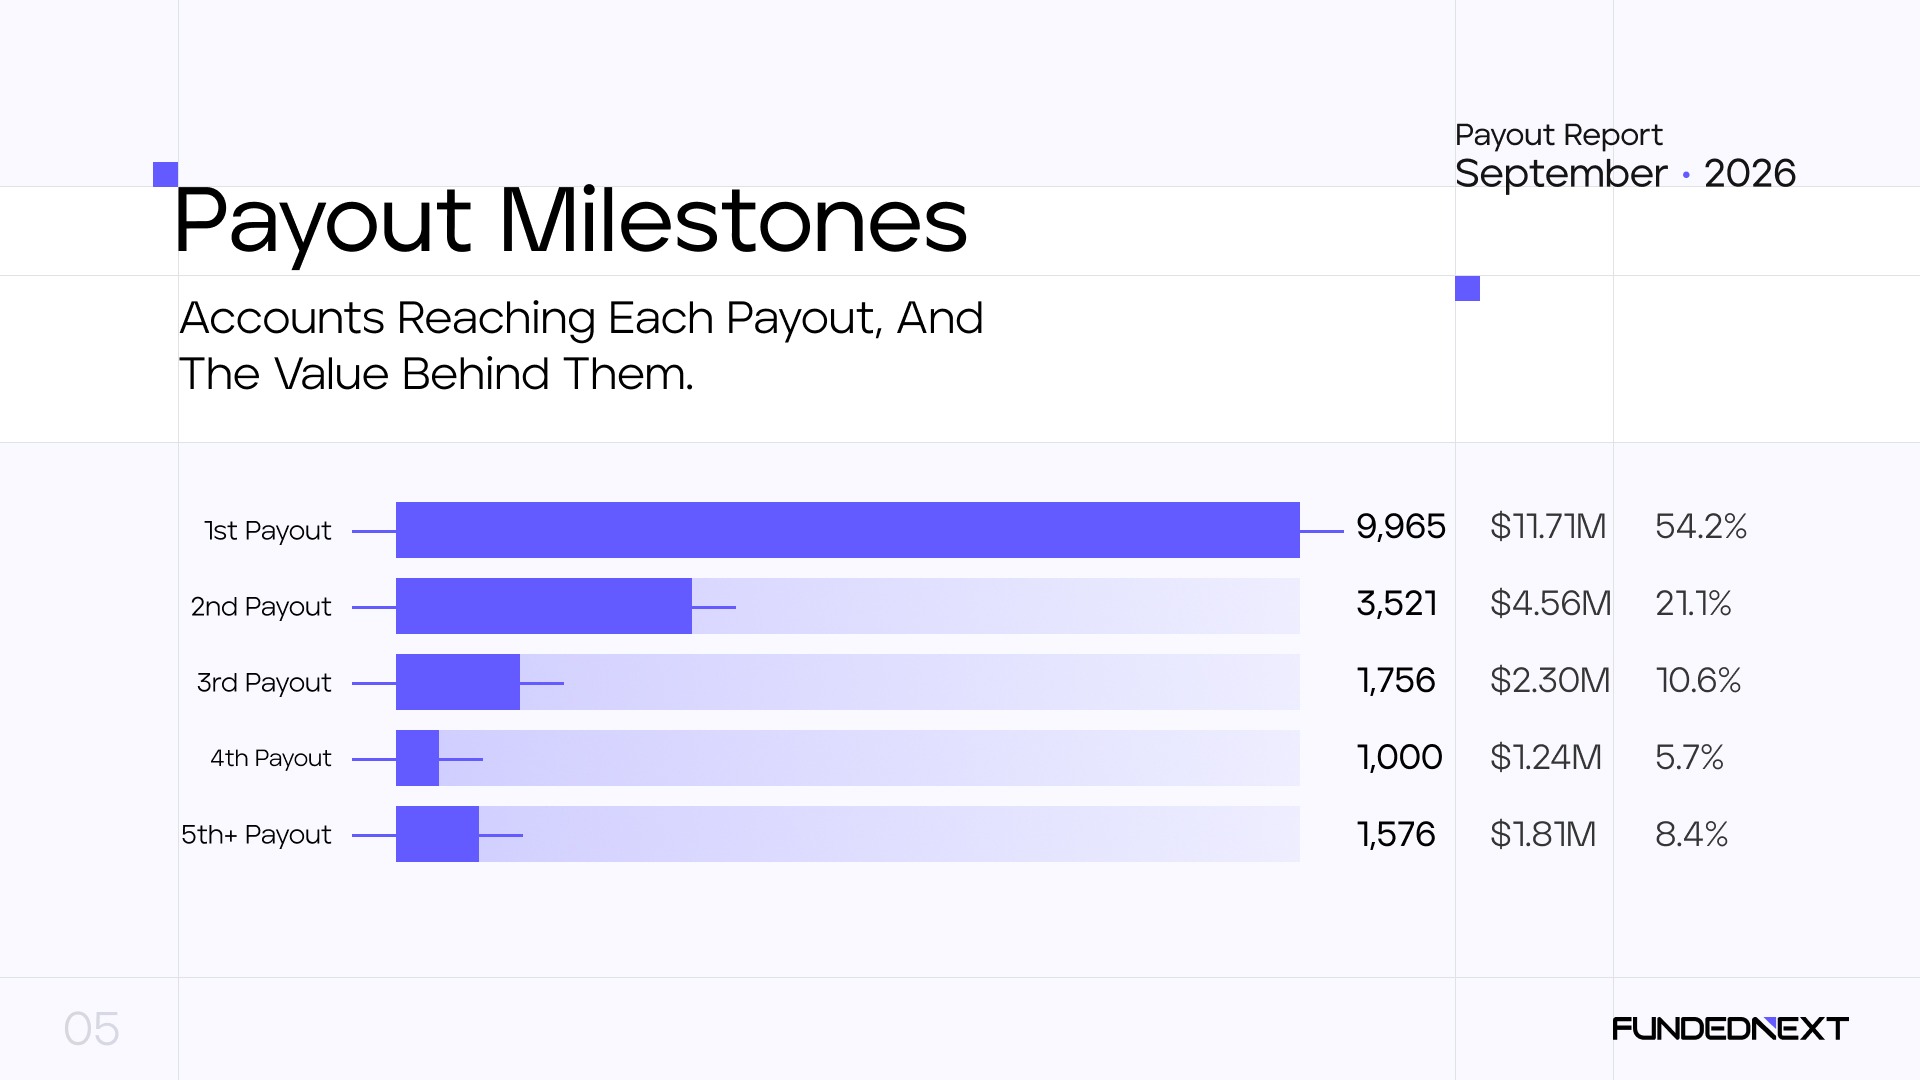
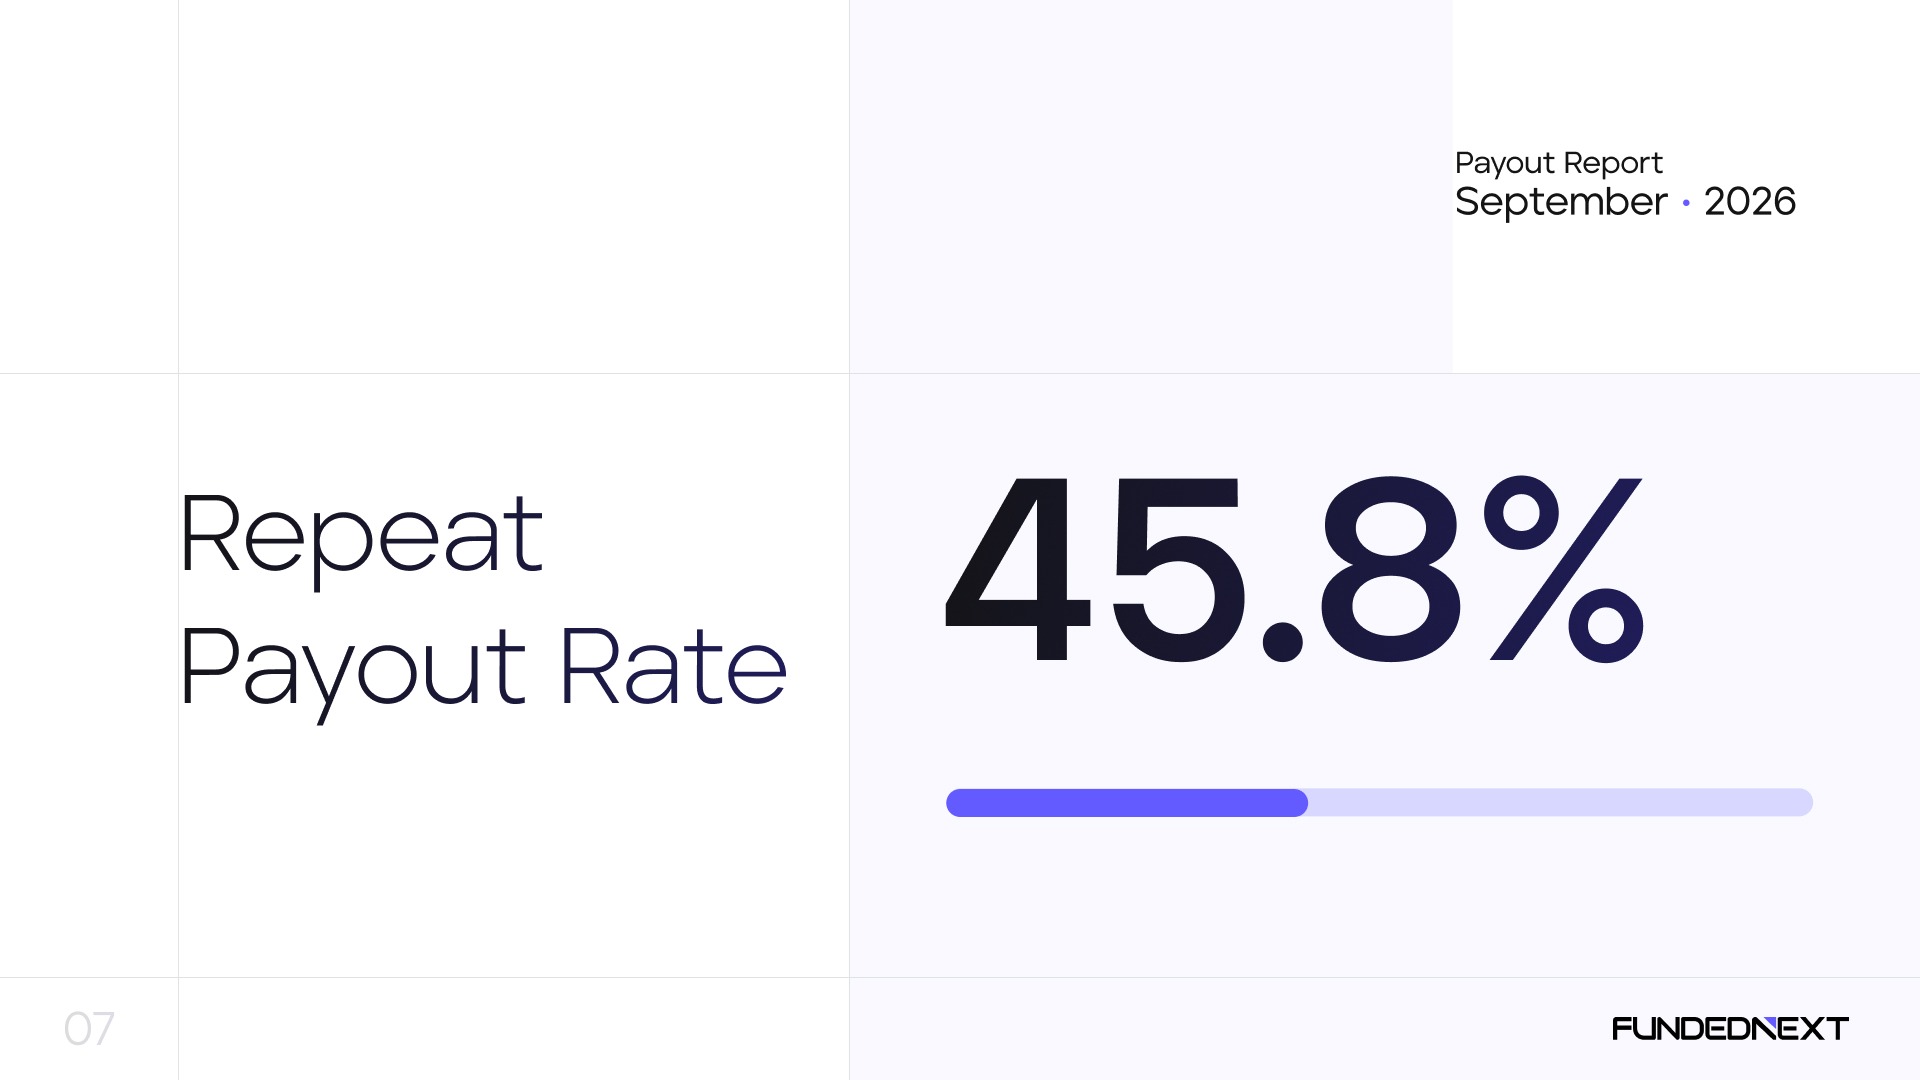
55.9% of September’s payouts (9,965 transactions) were first payouts from a funded account. The other 44.1% went to accounts that had been paid before. By value, first payouts came to $11.71M, or 54.2% of the month’s total, and repeat payouts made up the other 45.8%.
The 2nd-payout count (3,521) equals about 35% of the 1st-payout count (9,965). That is the steepest step on the ladder, and the 3rd and 4th payout counts step down further, to 1,756 and 1,000. The 5th-and-beyond group is open-ended, so it naturally totals more than the 4th payout alone: 1,576 transactions worth $1.81M, or 8.4% of the month’s value, from accounts well into their payout history.
Payout Frequency: Traders
This table groups the 8,757 traders paid in September by the number of payouts they have received from FundedNext over their lifetime.
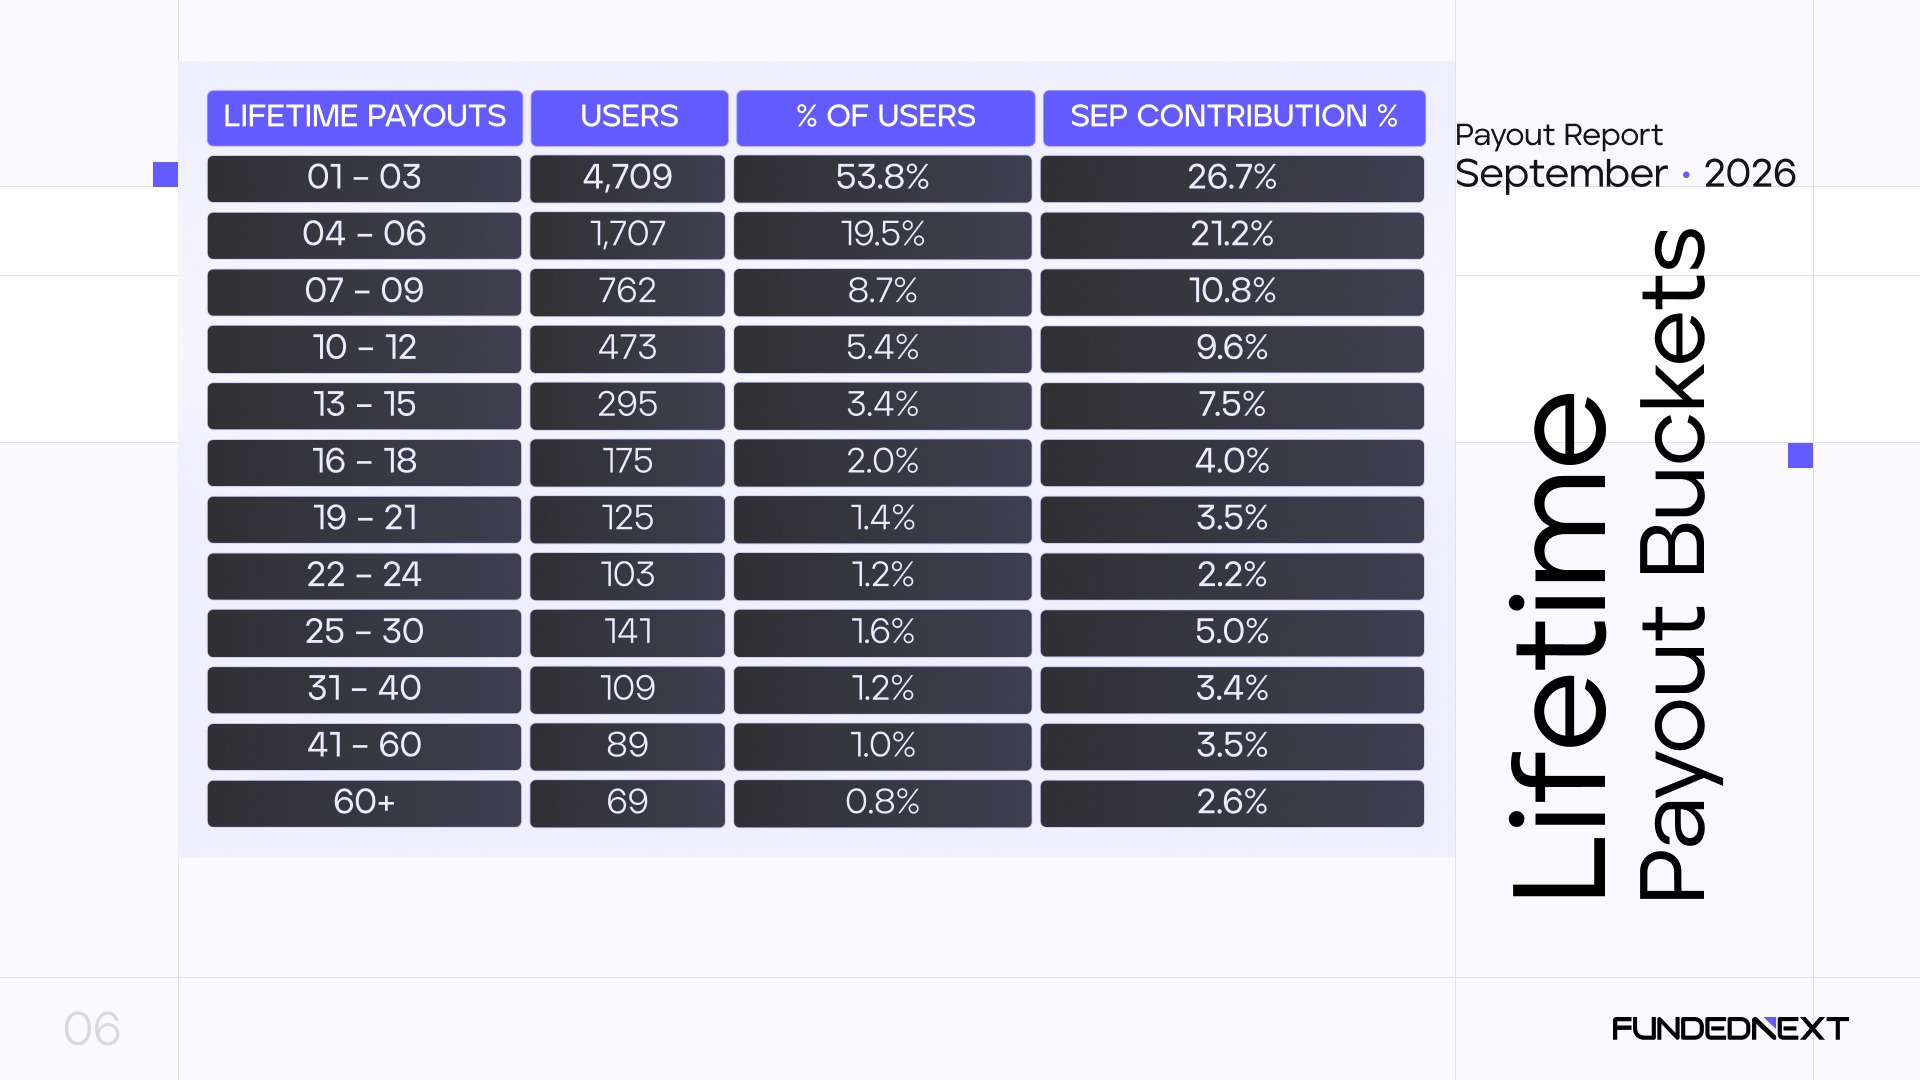
Traders with 1 to 3 lifetime payouts are 53.8% of the base and contributed 26.7% of the value. Value per trader generally rises with payout history: traders with 10 or more lifetime payouts are about 18% of the base and contributed about 41% of the value.
408 traders have 25 or more lifetime payouts and contributed about 14.5% of September’s value. 69 of them have passed 60 payouts.
Account Age
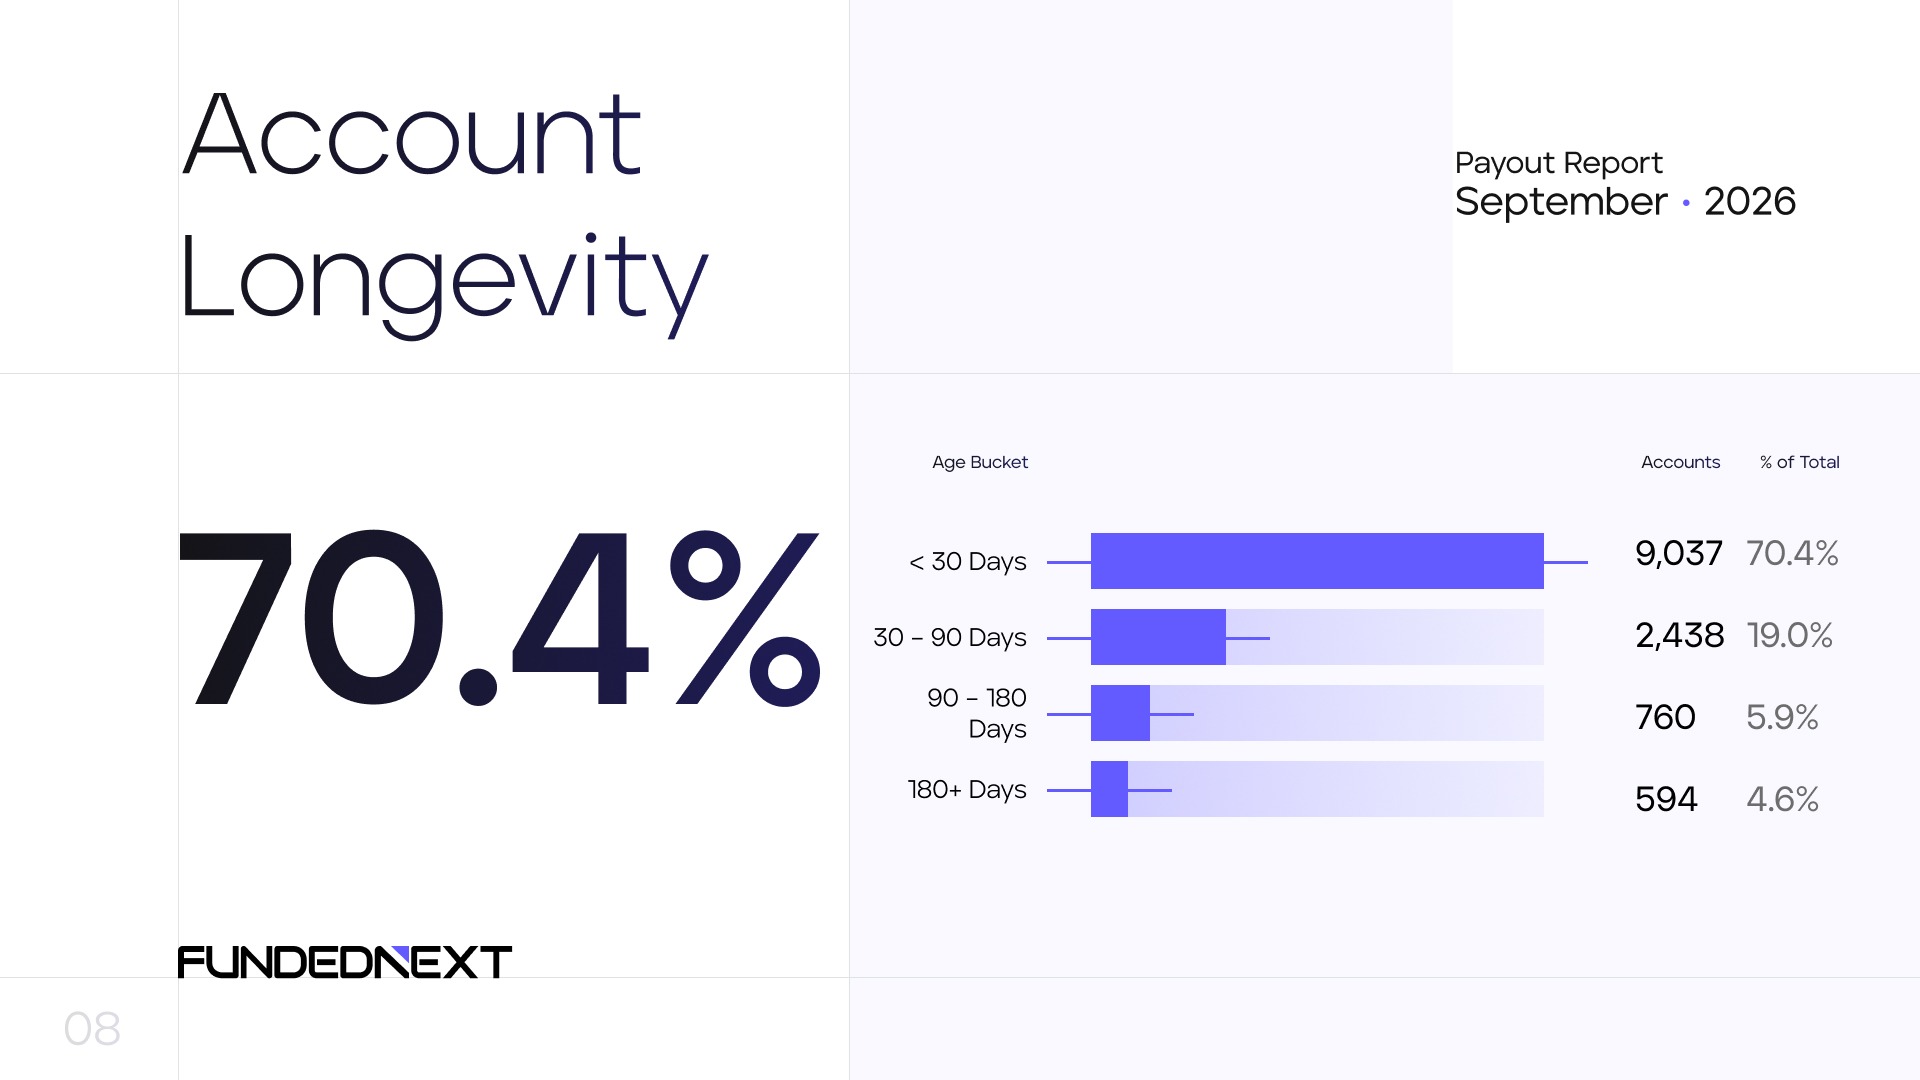
70.4% of the accounts paid in September (9,037) were under 30 days old. About 7 in 10 paid accounts were less than a month old. The age groups below cover 12,829 of the 12,881 paid accounts, and the percentages are calculated on that base.
| Account age | Accounts | Share |
| Under 30 days | 9,037 | 70.4% |
| 30 to 90 days | 2,438 | 19.0% |
| 90 to 180 days | 760 | 5.9% |
| Over 180 days | 594 | 4.6% |
1,354 accounts, about 1 in 10, were older than 90 days. 594 of those were more than six months old and still received a payout in September.
Scaling to a Higher Tier
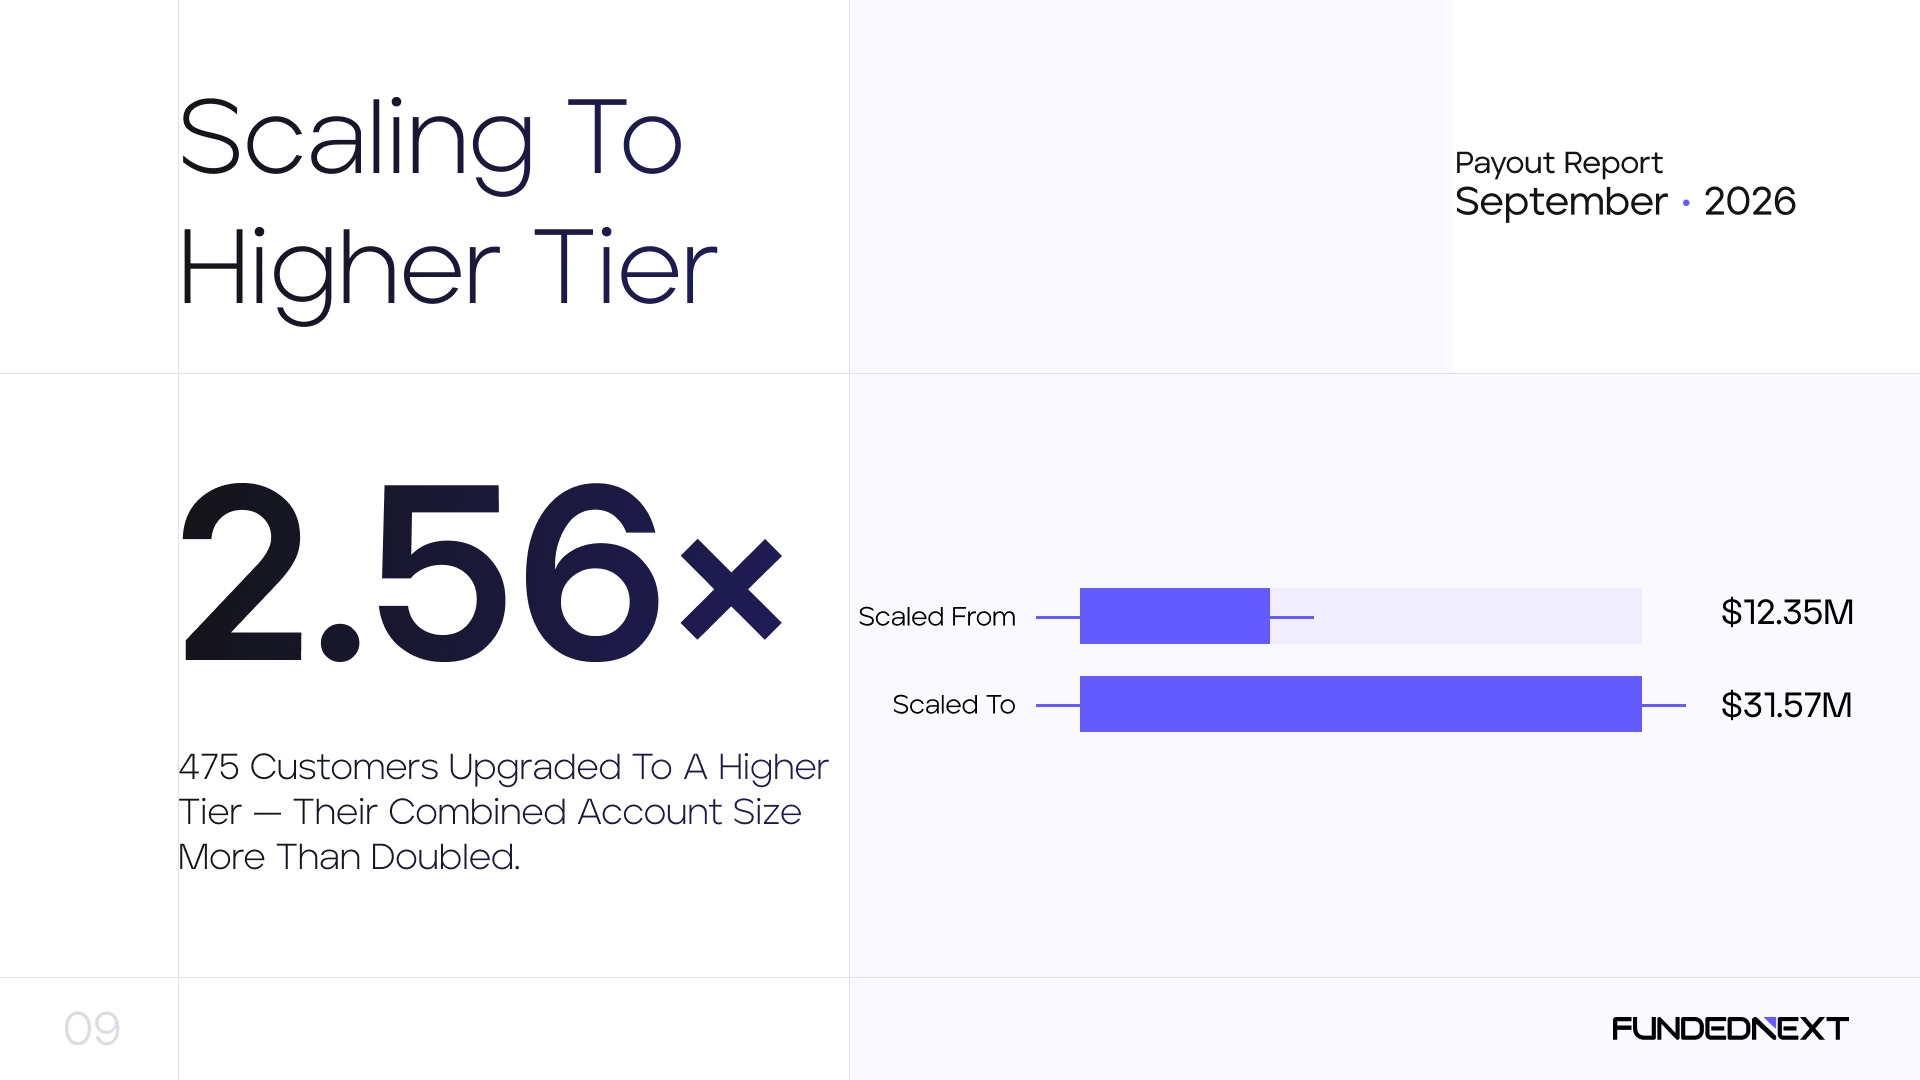
475 traders moved to a higher account tier in September under FundedNext’s performance-based scaling. Their combined account size grew 2.56×, from $12.35M to $31.57M.
Per trader, that is roughly $26K before scaling and $66K after.
September’s Highest Payouts
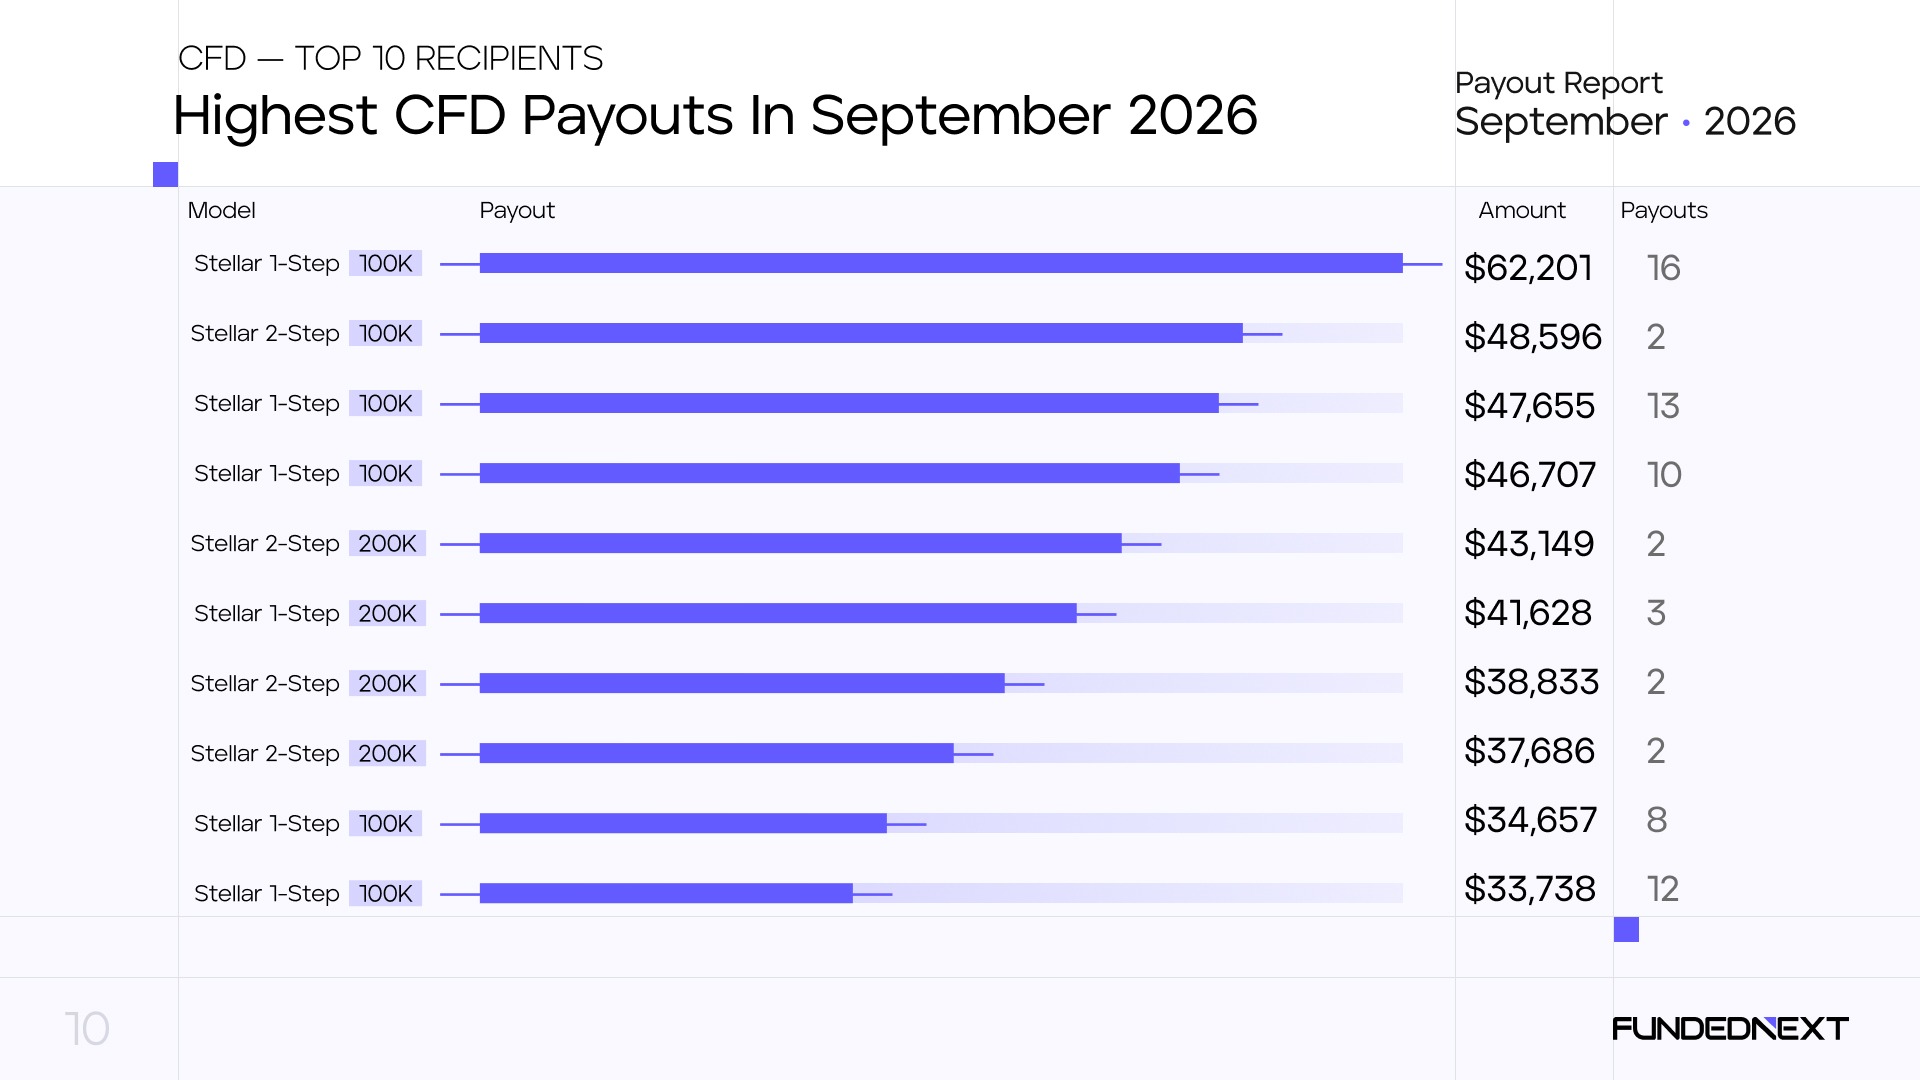
The top CFD recipient in September received $62,201 across 16 payouts. The runner-up received $48,596 in 2 payouts. Stellar 1-Step 100K accounts hold 5 of the 10 positions.
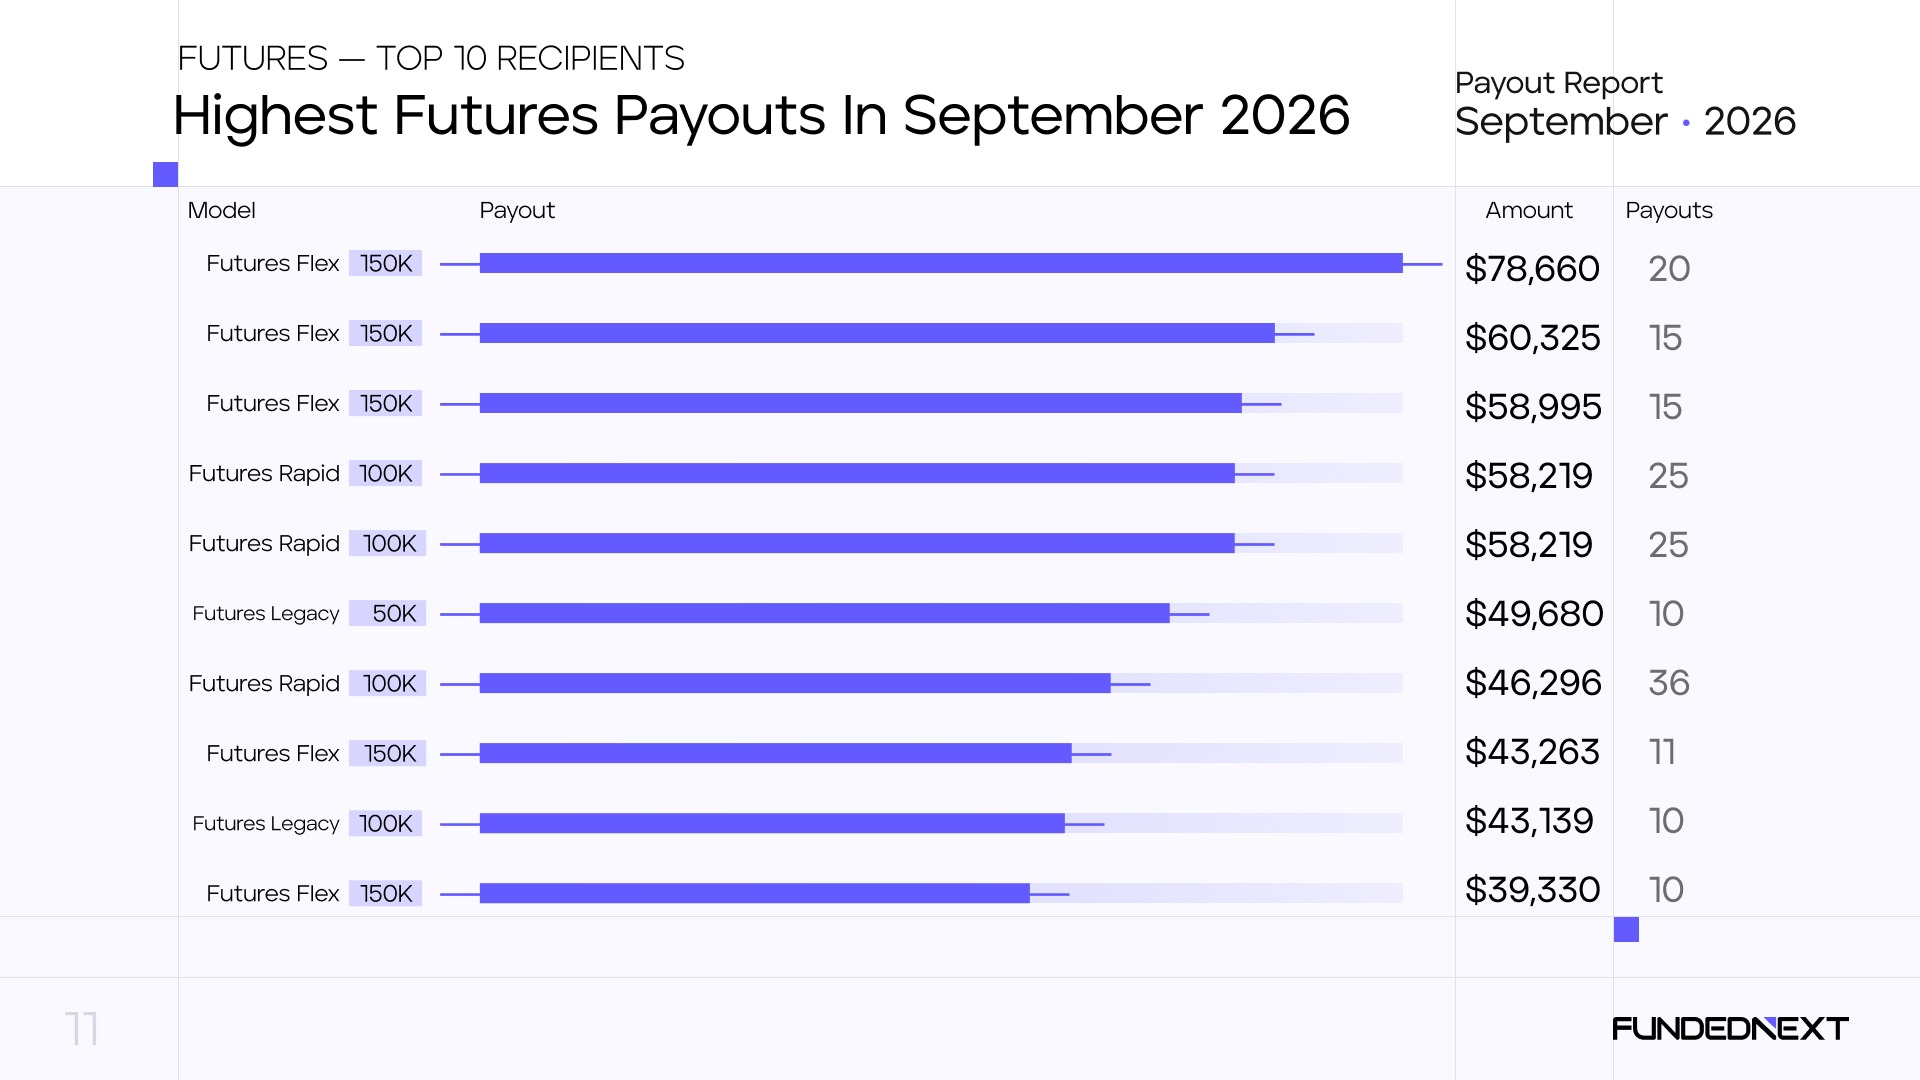
The top Futures recipient received $78,660 across 20 payouts. Futures Flex 150K holds 5 of the 10 positions, including the top 3. Futures Rapid 100K recipients logged the most payouts, 25 to 36, for mid-table totals. Rank 7 was paid the most often: 36 payouts for $46,296.
All-Time Highest Cumulative Payouts
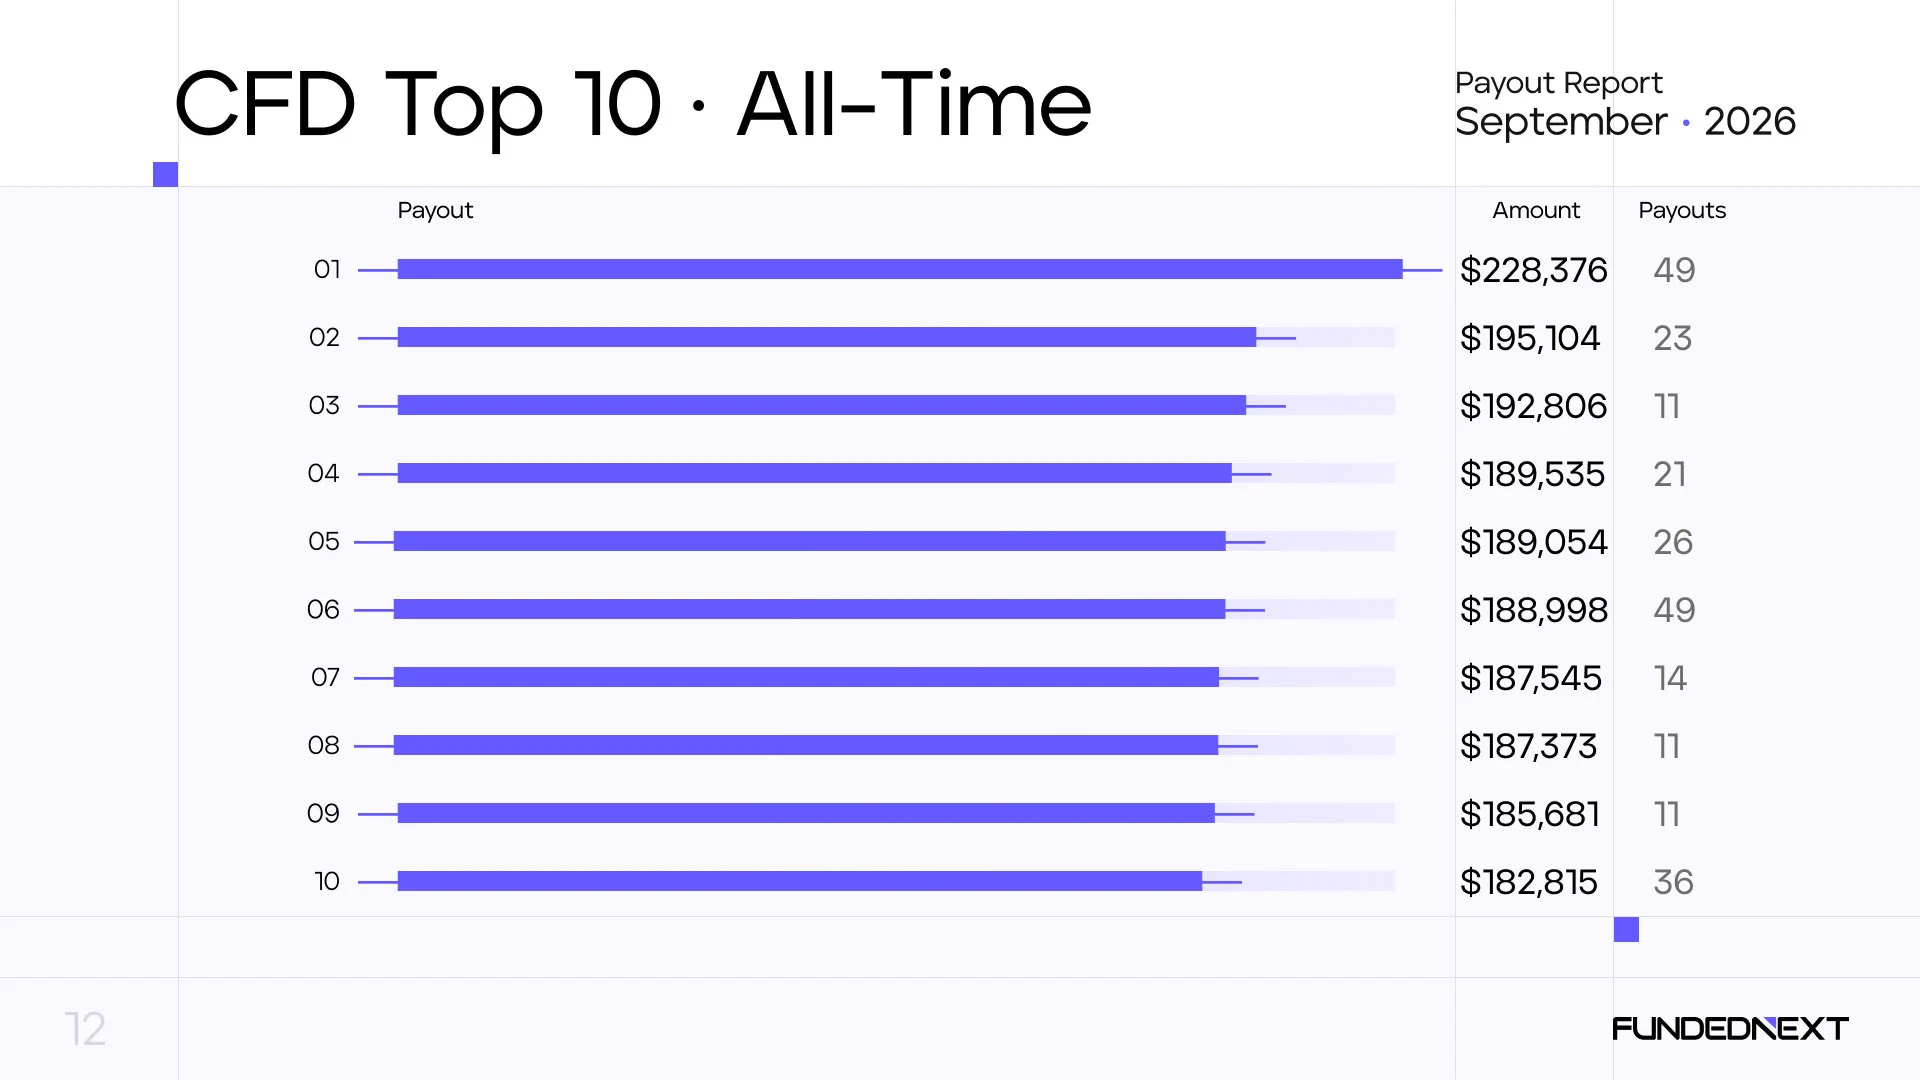
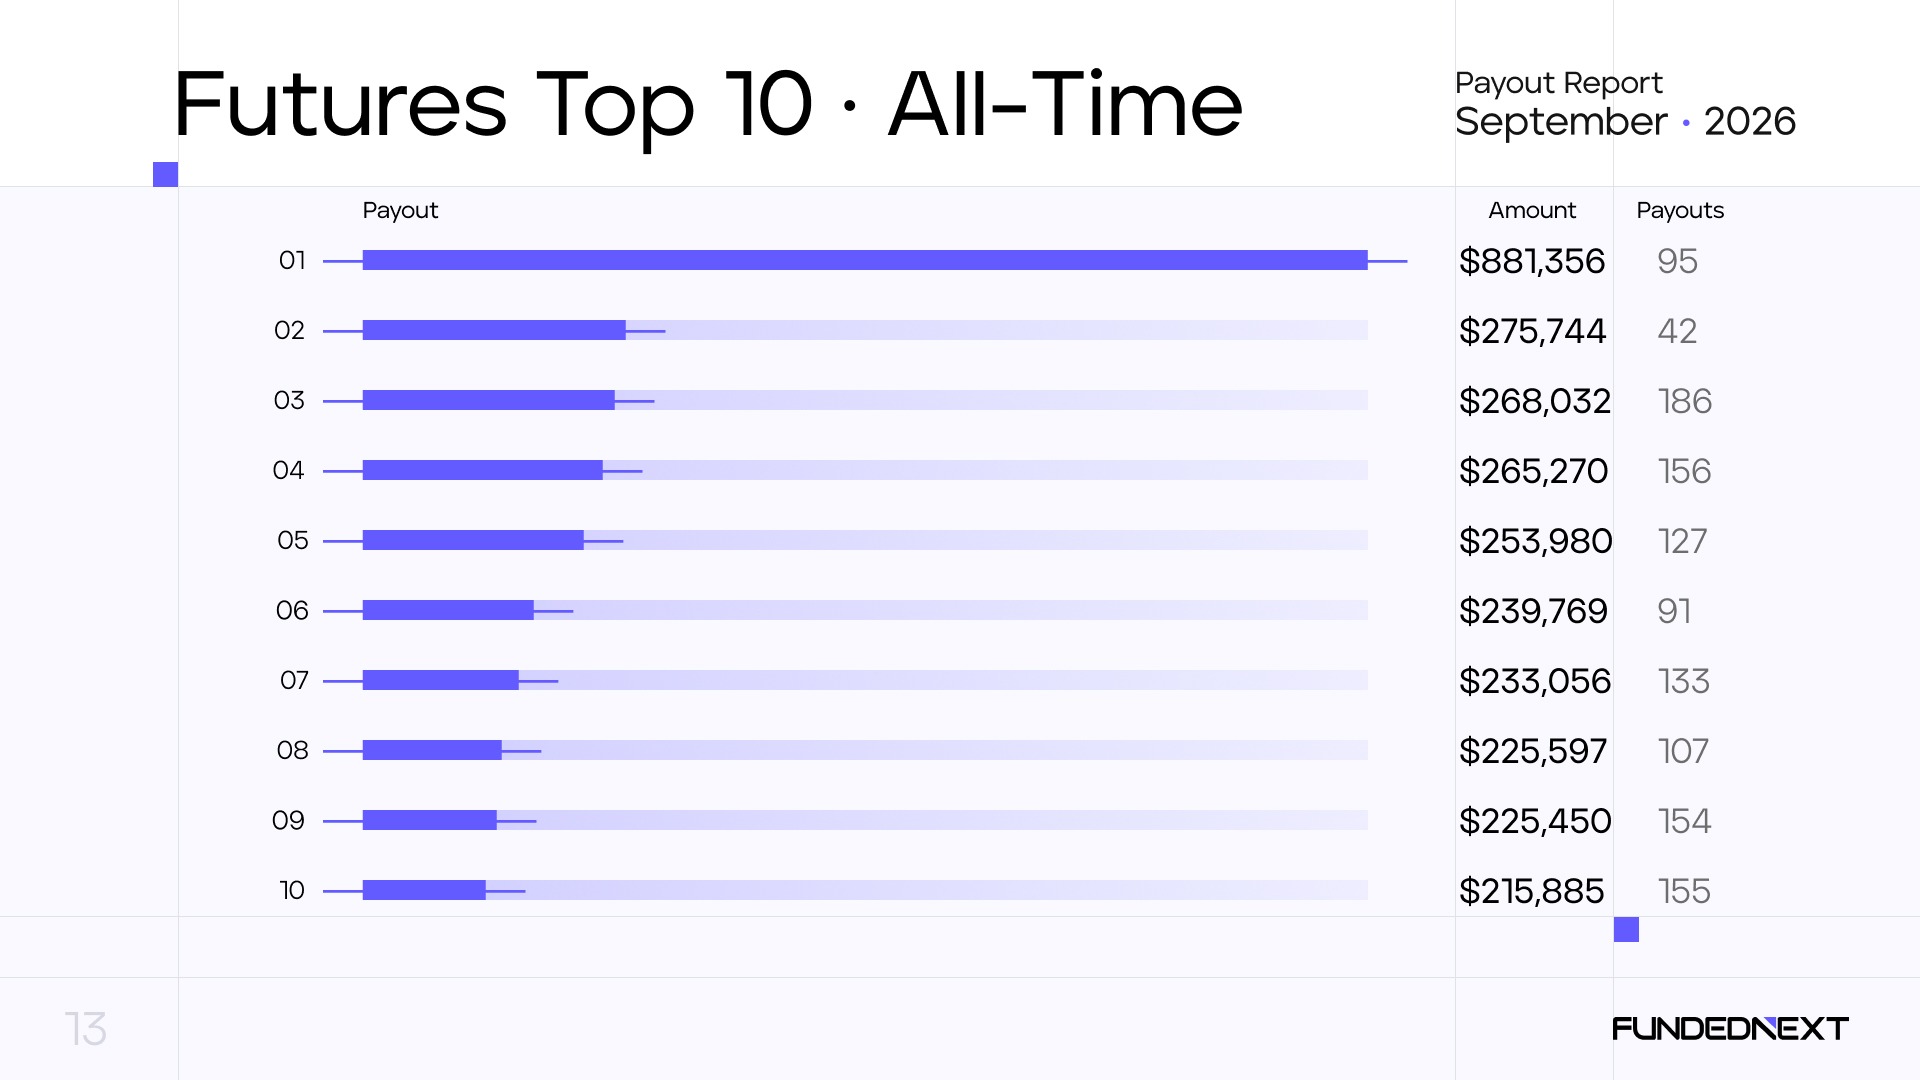
These are the highest-paid traders across the full history of FundedNext, through September 2026.
In CFD, the top recipient has received $228,376 across 49 payouts, about $33K ahead of rank 2. Ranks 2 to 10 sit within roughly $12K of each other.
In Futures, the top recipient has received $881,356 across 95 payouts, more than 3× the rank 2 total. Ranks 2 to 10 fall within about $60K of each other.
Payouts Since Inception
FundedNext has paid $393.4M+ to traders since inception, across 307,702 transactions. September 2026 is one month of that.
Read the general rules before you buy.
Payout figures describe past payouts. They do not predict future results.