
Table of Contents
Every month, FundedNext processes thousands of payout transactions across its global trader base. For the first time, we are publishing the complete picture of what that looks like, not a highlight reel, but the full dataset: transaction volume, processing times, payout sizes, trader tenure, and the actual trading behavior behind the withdrawals.
February 2026: $15.19M paid to 8,340 traders. Here is how it broke down.
This report will be published monthly, on the same schedule, in the same format. The goal is a consistent, verifiable record, one that lets traders track how the platform performs over time, not just in any given month.
February by the Numbers
13,712 individual payout transactions were processed across 10,346 funded accounts held by 8,340 unique traders.
The distinction between account count and trader count matters. Some traders hold multiple funded accounts simultaneously, which is why funded accounts outnumber traders. The transaction count reflects system throughput; the trader count reflects how many people were paid.
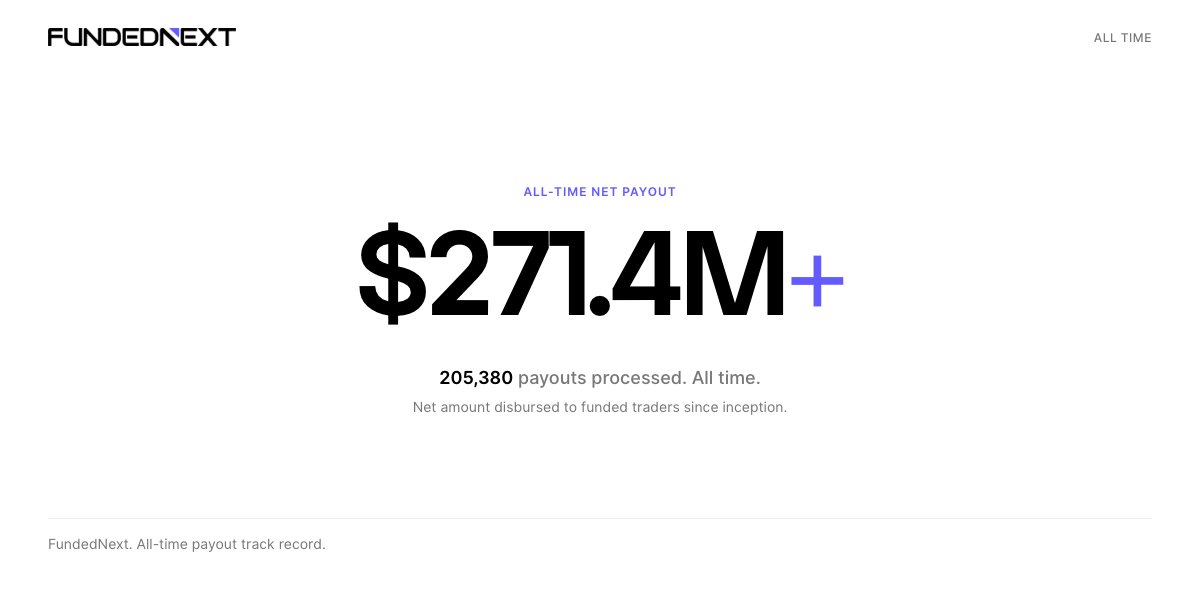
Since inception, FundedNext has processed 205,380 payout transactions totaling $271.4M+ in net disbursements.
February summary:
| Total paid | $15.19M |
| Unique traders paid | 8,340 |
| Funded accounts | 10,346 |
| Total transactions | 13,712 |
Processing Speed
Median payout processing time in February: 4 hours 44 minutes. The mean was 5 hours 8 minutes, a small number of reviews requiring additional checks pulls the average slightly above the median.
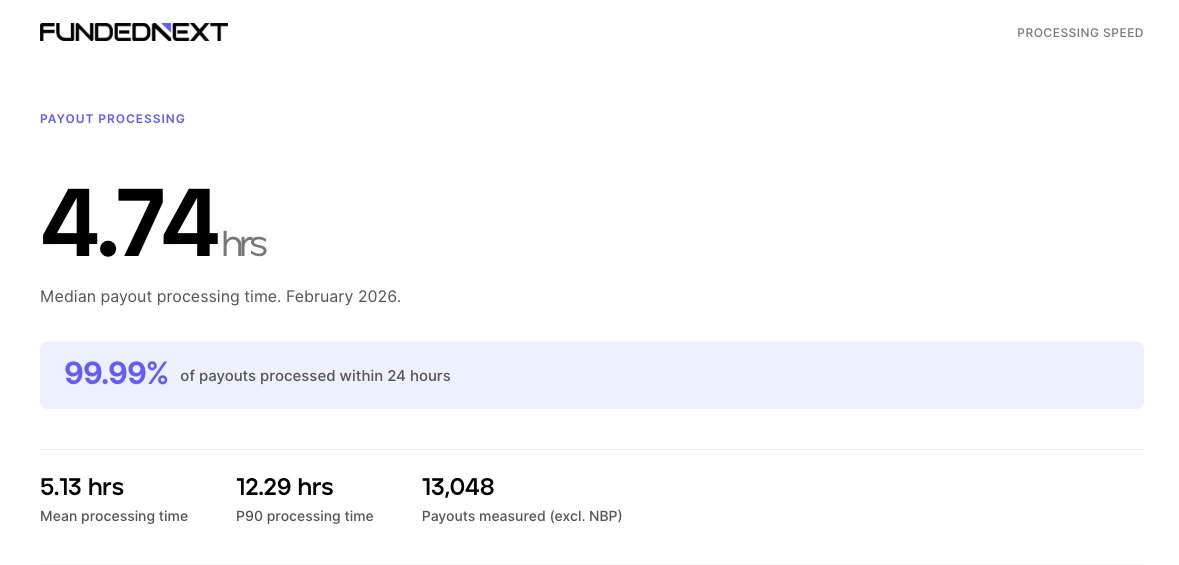
At the 90th percentile, payouts cleared in under 13 hours. 99.98% were processed within 24 hours. One transaction exceeded the 24-hour mark.
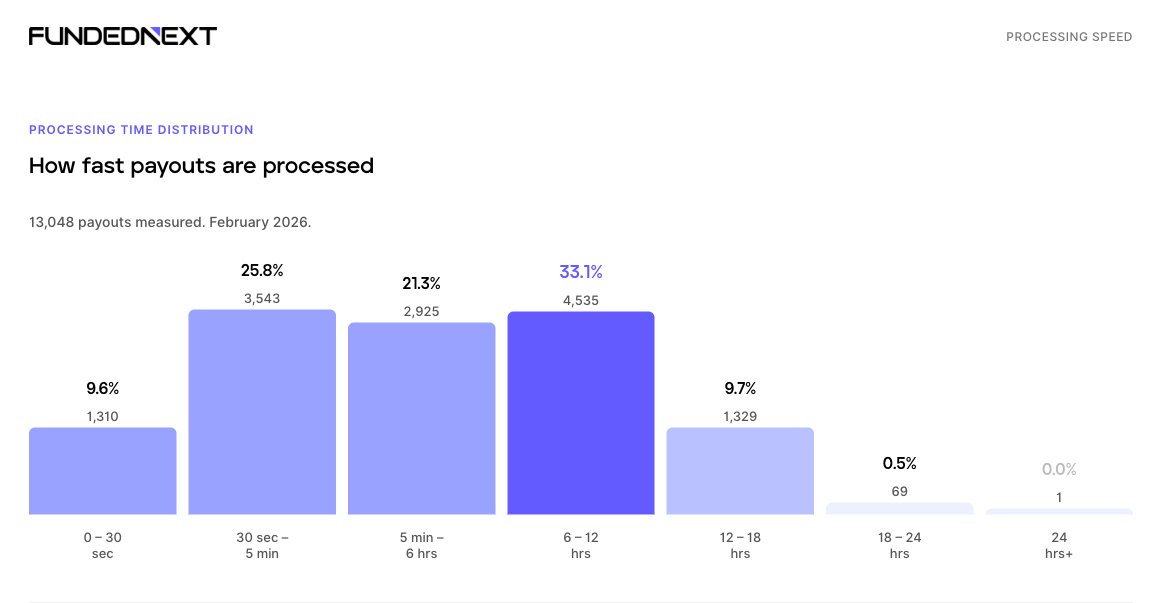
The distribution is more informative than any single average. Over a third of February’s payouts, 35.4% were completed in under 5 minutes. The largest concentration of transactions sits in the 6-to-12-hour window, which reflects standard overnight processing batches.
Payout Size Distribution
More than half of February’s payout volume, which is 54.4%, fell in the $1,000 to $5,000 range. That is the center of gravity for the month.
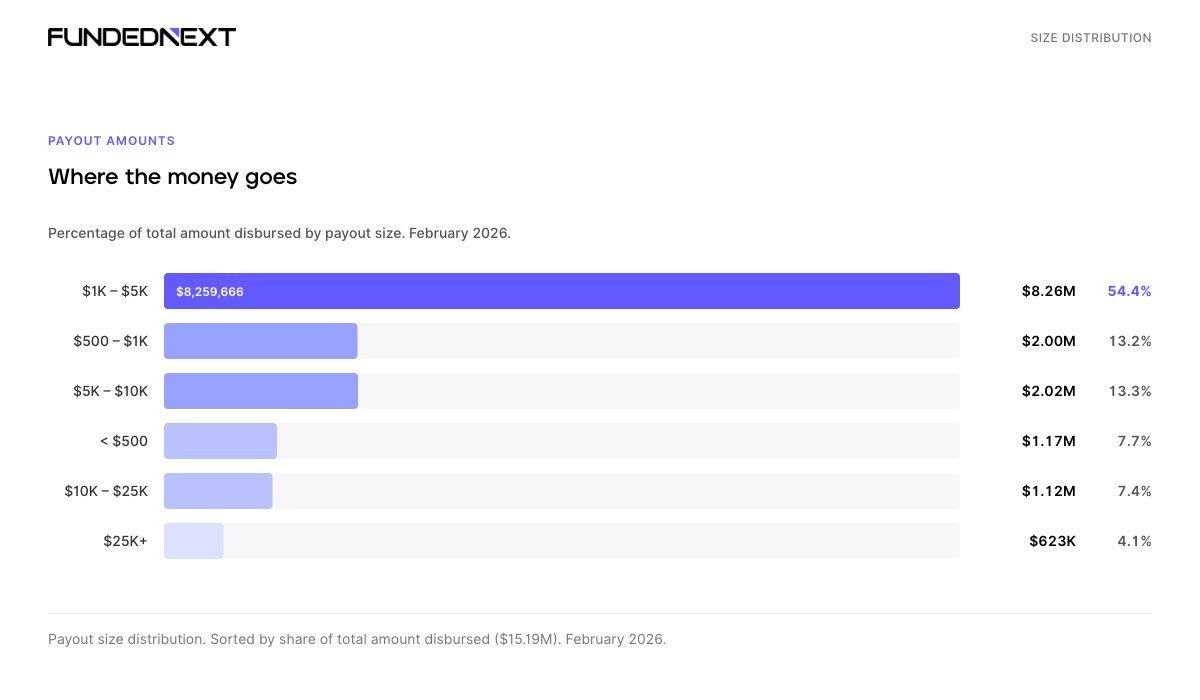
The median payout was $567. The mean was $1,119. The gap between the two reflects a smaller number of larger payouts pulling the average upward.
$623K went to payouts of $25,000 and above. The single largest payout in February was $60,580.
Payout Frequency: Account Level
Half of February’s payouts came from funded accounts receiving their first withdrawal. The other half came from accounts collecting a second, third, fourth, or fifth-and-beyond payout.
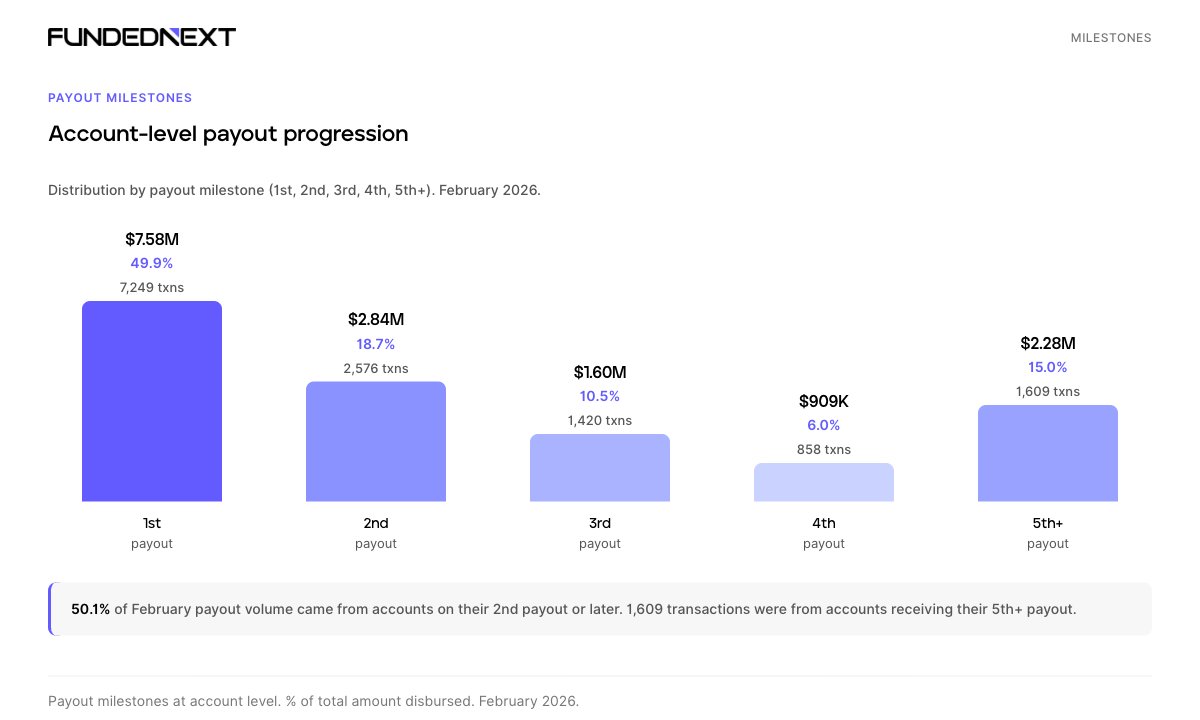
The 5th-and-beyond bucket recorded 1,609 transactions, more than the fourth-payout bucket. A distinct cohort of traders has built a sustained payout track record on the platform, not just completing a single cycle.
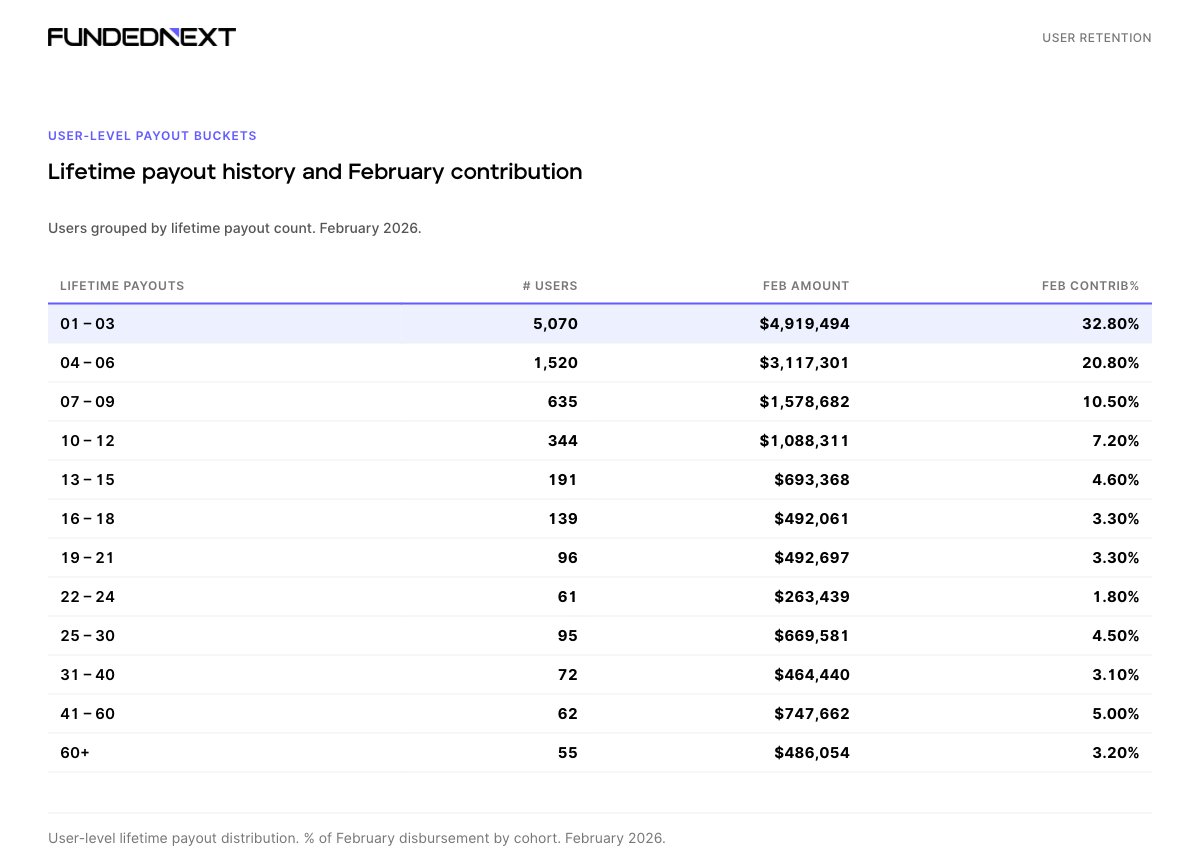
Payout Frequency: Trader Level
Looking at the traders behind the accounts: February’s payout recipients grouped by total lifetime payouts from FundedNext show a clear distribution across all experience levels.
The largest group consists of traders early in their funded journey, collecting their first through third payouts. But the data does not stop there.
| Traders with 31–40 lifetime payouts | 72 |
| Traders with 41–60 lifetime payouts | 62 |
| Traders with 60+ lifetime payouts | 55 |
| Revenue from 60+ payout group in February | $486,054 |
| Traders with 25+ lifetime payouts | 284 |
| Revenue from 25+ payout group in February | $2.37M (15.8% of total) |
284 traders with 25 or more lifetime payouts collected $2.37M in February; 15.8% of the month’s total volume. These traders have been active with FundedNext long enough to build a significant payout history. That is not a one-cycle relationship.
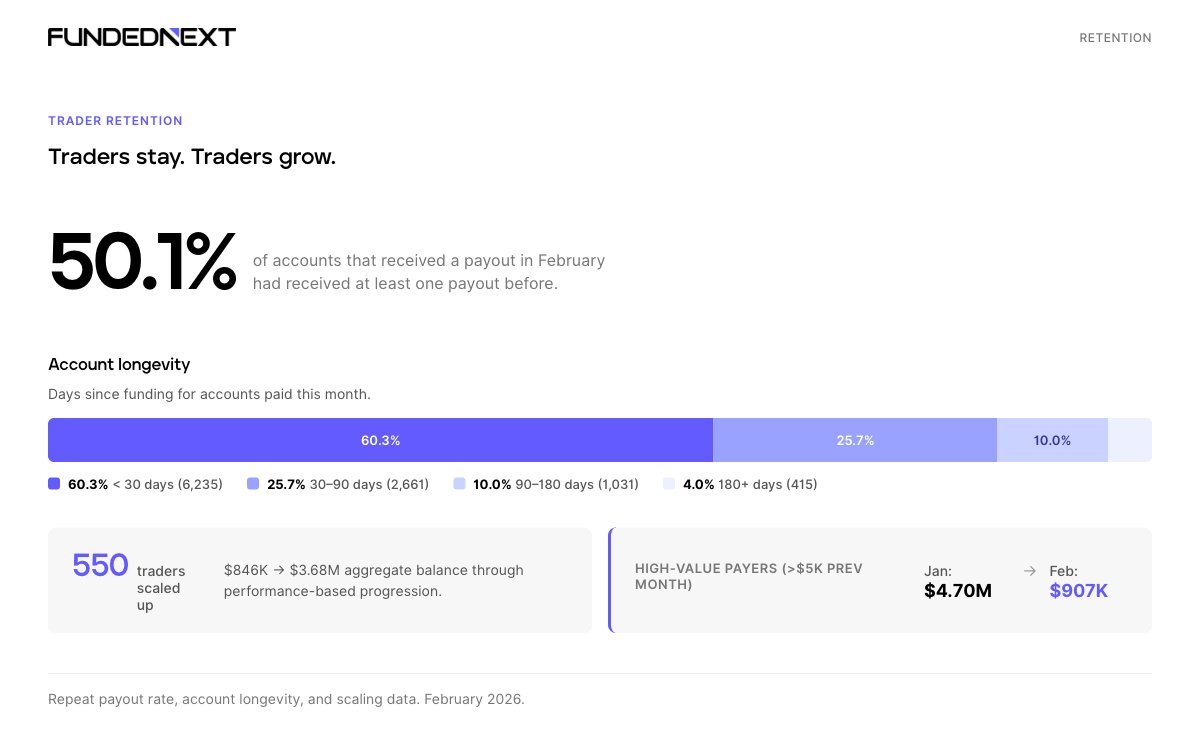
Account Age and Progression
50.1% of accounts that received a payout in February had been paid at least once before.
60% of paid accounts were funded within the last 30 days. 26% were funded 1 to 3 months prior. 14% have been funded for more than 90 days , including 415 accounts that have been active for over 6 months and are still generating payouts.
550 traders were scaled to higher account tiers in February through FundedNext’s performance-based progression. $846K in funded balance became $3.68M across those accounts.
How Payout Recipients Traded
This section covers trading behavior data from funded traders who received payouts in February. CFD and Futures figures are presented separately; the two products are structurally different, and combined averages would obscure rather than inform.
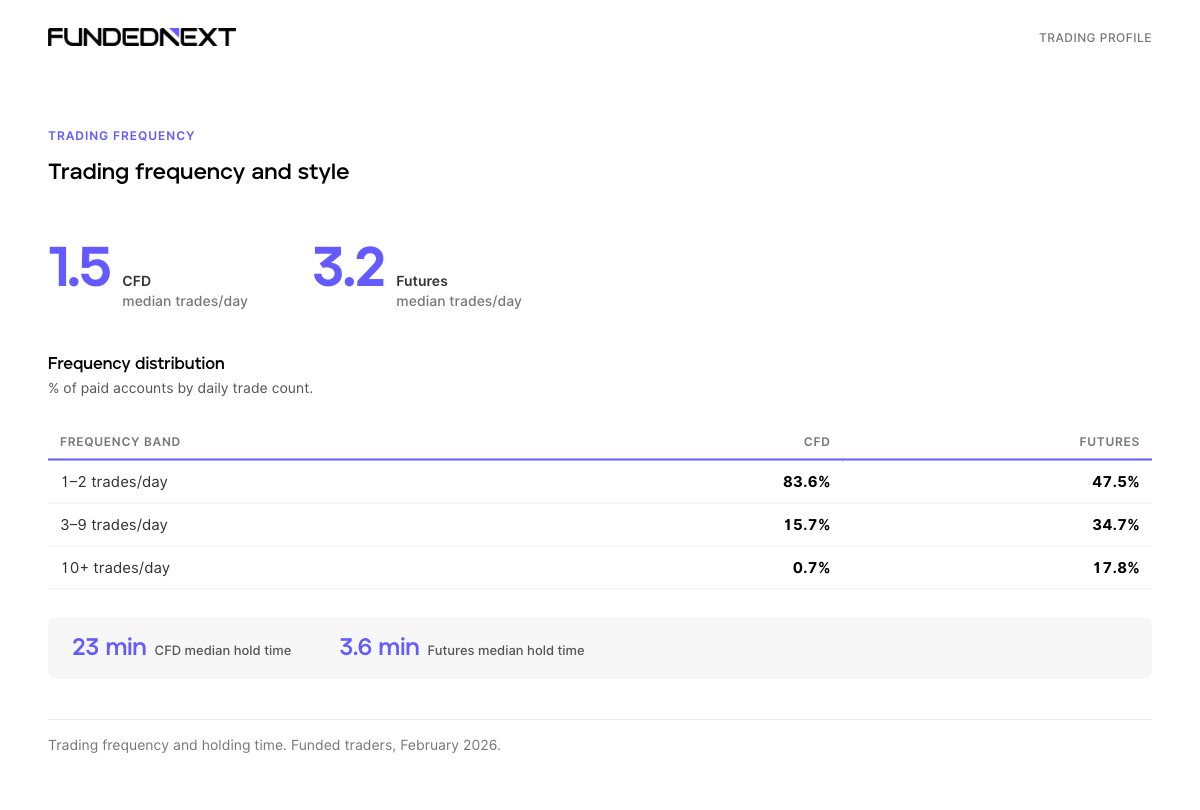
Trading Frequency
The median CFDs payout recipient placed 1.5 trades per day. Futures: 3.2.
83.6% of paid CFD accounts traded at low frequency; 1 to 2 trades per day. Futures accounts showed a wider spread: 47.5% traded 1–2 per day, 34.7% traded 3–9, and 17.8% placed 10 or more trades daily.
Win Rates and Profit Quality
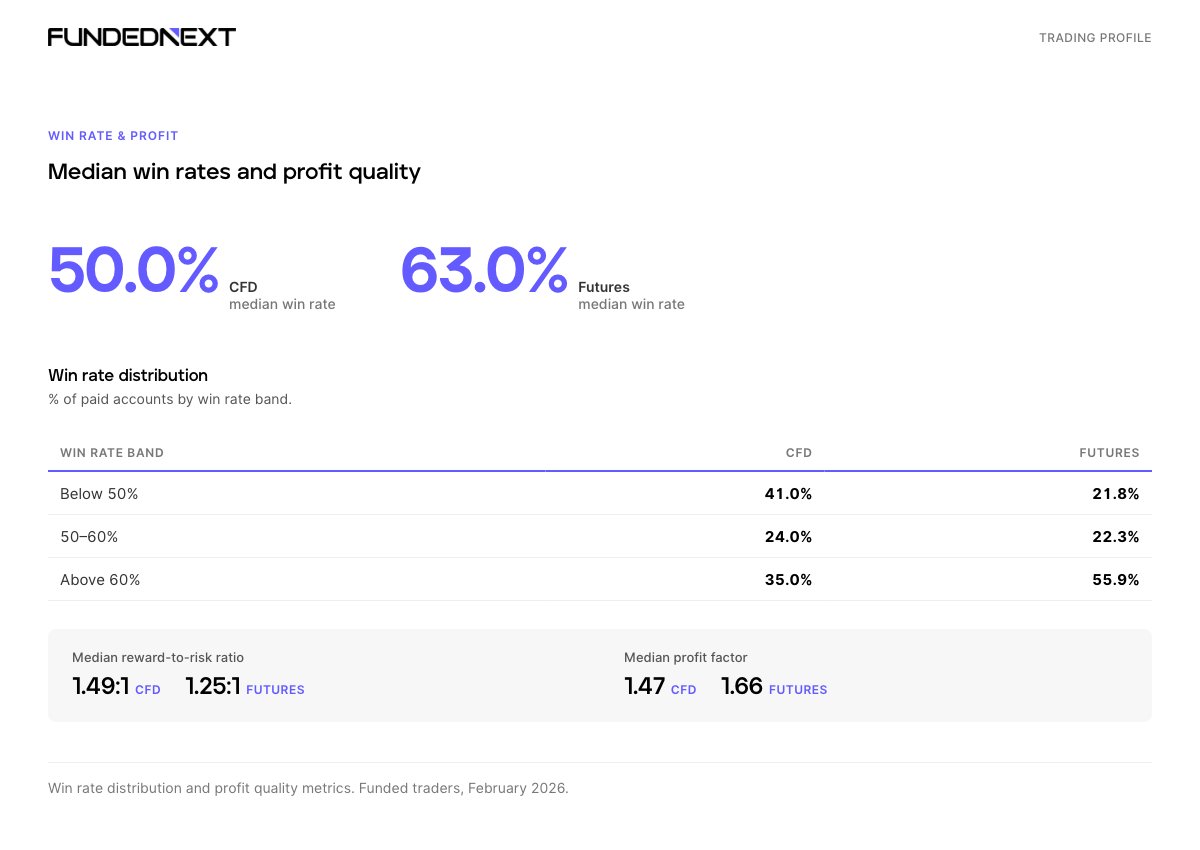
Median win rate for CFD payout recipients: 50.0%. Futures: 63.0%.
41% of paid CFD accounts had a win rate below 50%, meaning they closed more losing trades than winning ones and still received a payout. The offset was favorable risk-to-reward ratios: the median for CFD was 1.49:1. Reaching payout does not require winning the majority of trades. It requires wins to be large enough relative to losses.
Median profit factor (gross profit divided by gross loss): 1.47 for CFD, 1.66 for Futures.
Instrument Diversity
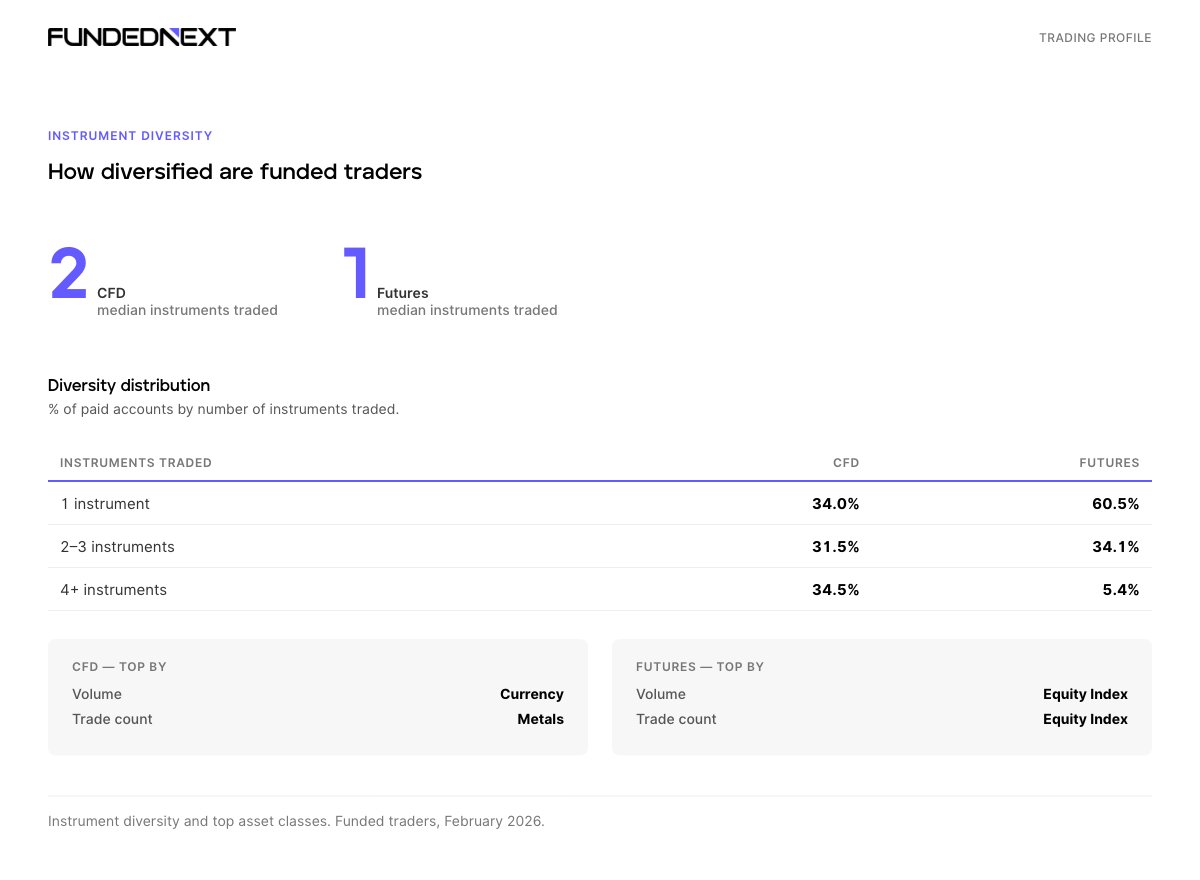
The median CFD payout recipient traded 2 instruments. Futures: 1. 60.5% of paid Futures accounts traded a single instrument. CFD accounts were more evenly split, roughly a third traded one instrument, a third traded two to three, and a third traded four or more.
Top asset class by volume: currency pairs for CFD, equity indices for Futures. Top by trade count: metals for CFD, equity indices again for Futures.
Drawdown and Recovery
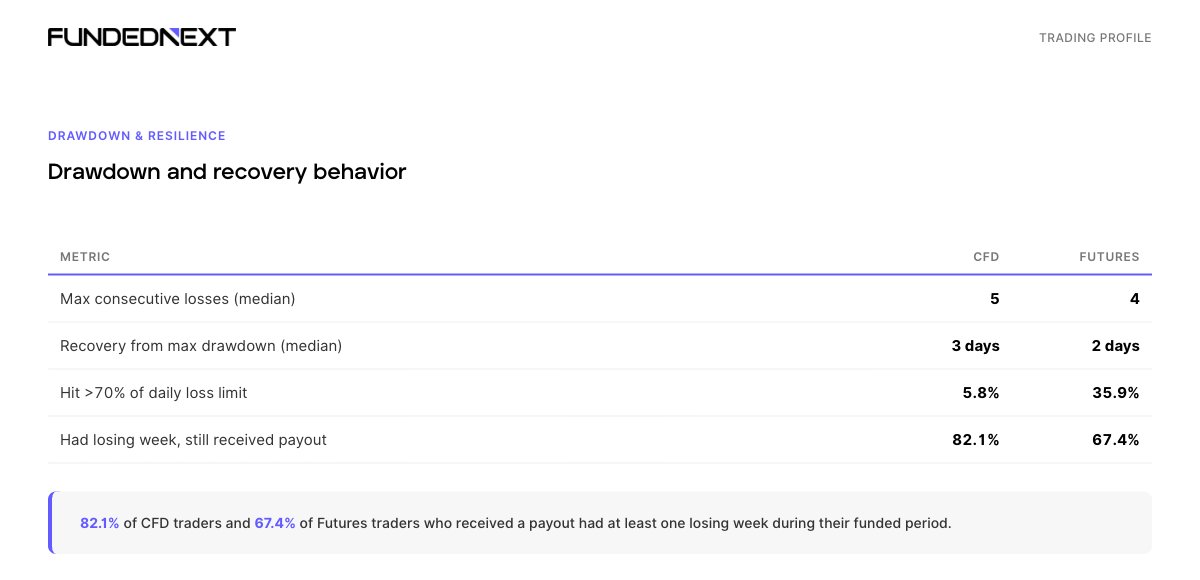
Median max consecutive losing trades: 5 for CFD, 4 for Futures. Median recovery time from the deepest drawdown: 3 trading days for CFD, 2 for Futures.
82.1% of CFD traders and 67.4% of Futures traders who received a payout had at least one losing week during their funded period. Receiving a payout does not require a clean run. It requires managing losses when they come.
5.8% of paid CFD accounts hit more than 70% of their daily loss limit at some point during their funded period. For Futures, that figure is 35.9% (Bolt Challenge only), a structural difference in how the daily loss limit interacts with Futures contract sizing and tick values.
Time to First Payout
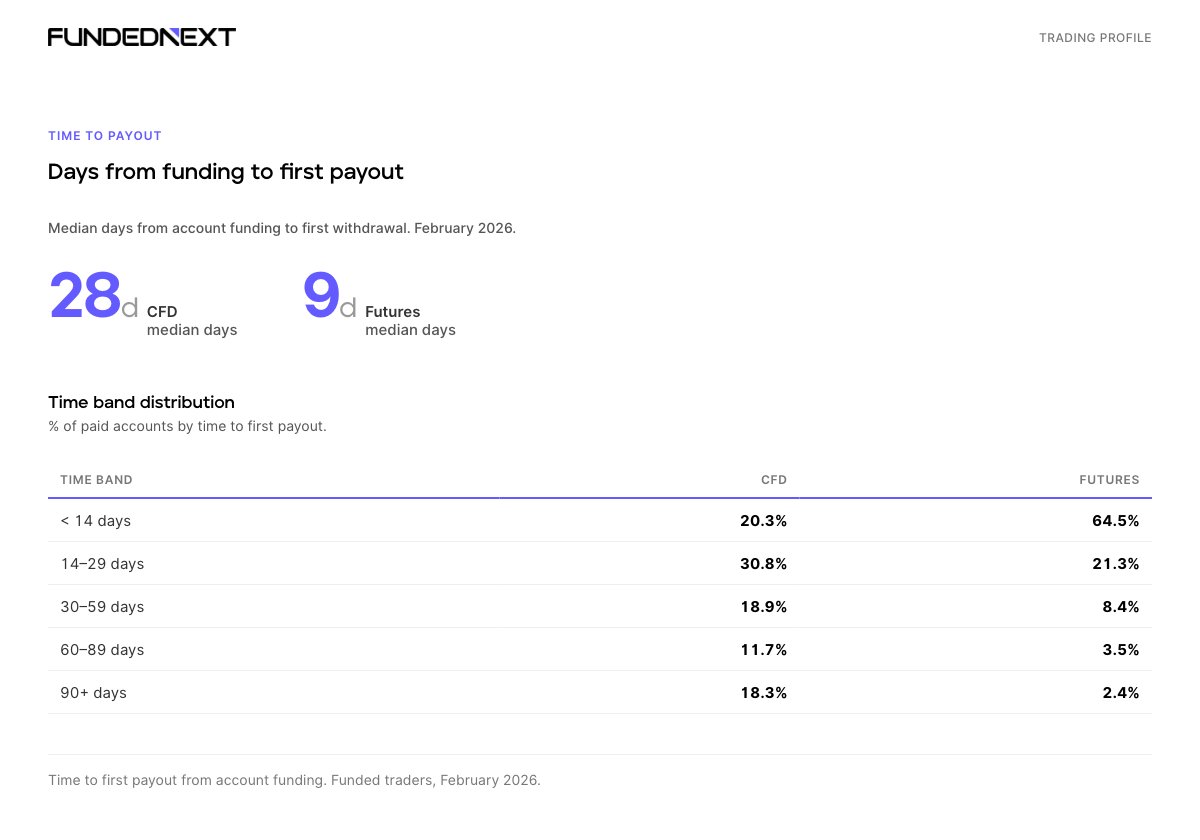
Median days from account funding to first payout request: 28 for CFD, 9 for Futures.
64.5% of Futures payout recipients submitted their first withdrawal within 14 days of funding. 20.3% of CFD recipients did the same. 18.3% of CFD traders took 90 or more days, compared to 2.4% on the Futures side.
The gap reflects how the two products work. Futures traders tend to take frequent, smaller payouts. CFD traders tend to build positions over longer cycles before withdrawing.
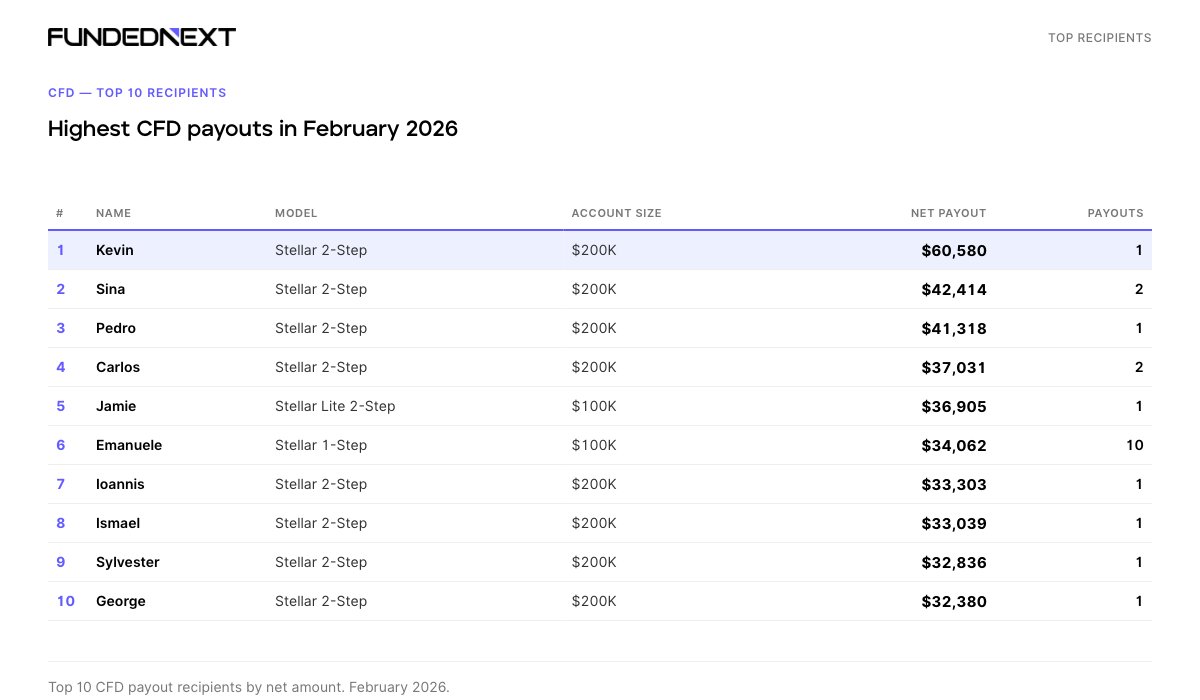
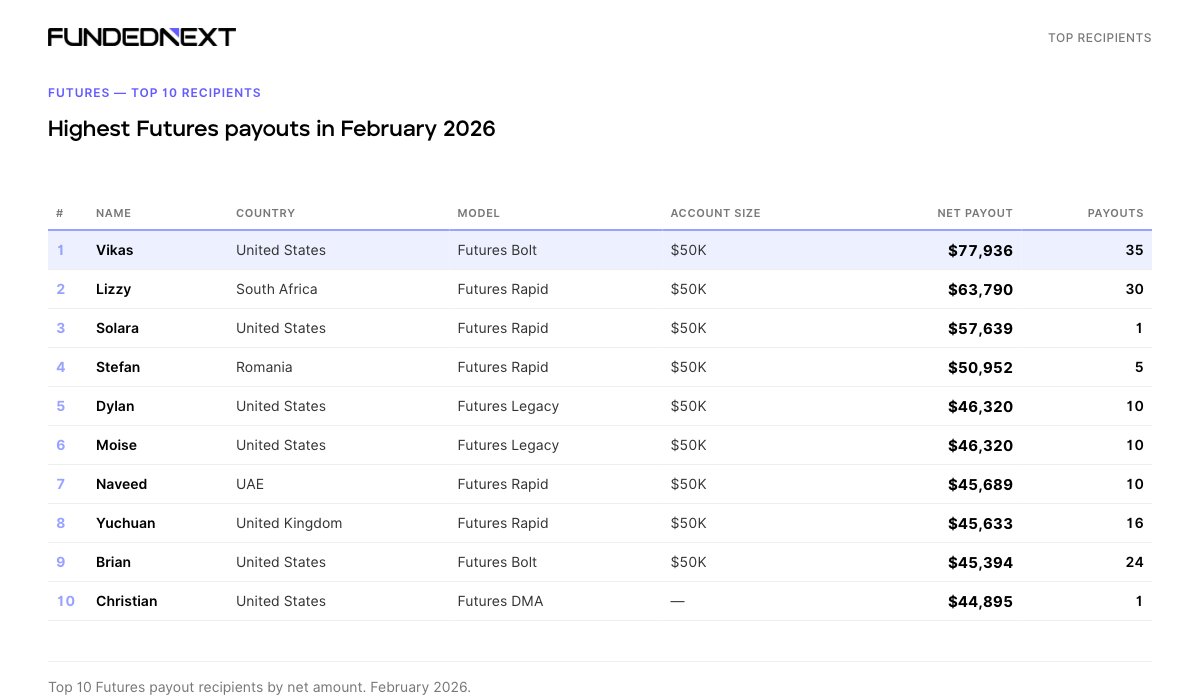
February’s Highest Single Payouts
The top 10 payout recipients for February 2026 are listed separately for CFD and Futures. The tables are included in the full report linked below.
CFD — Top 10, February 2026
Futures — Top 10, February 2026
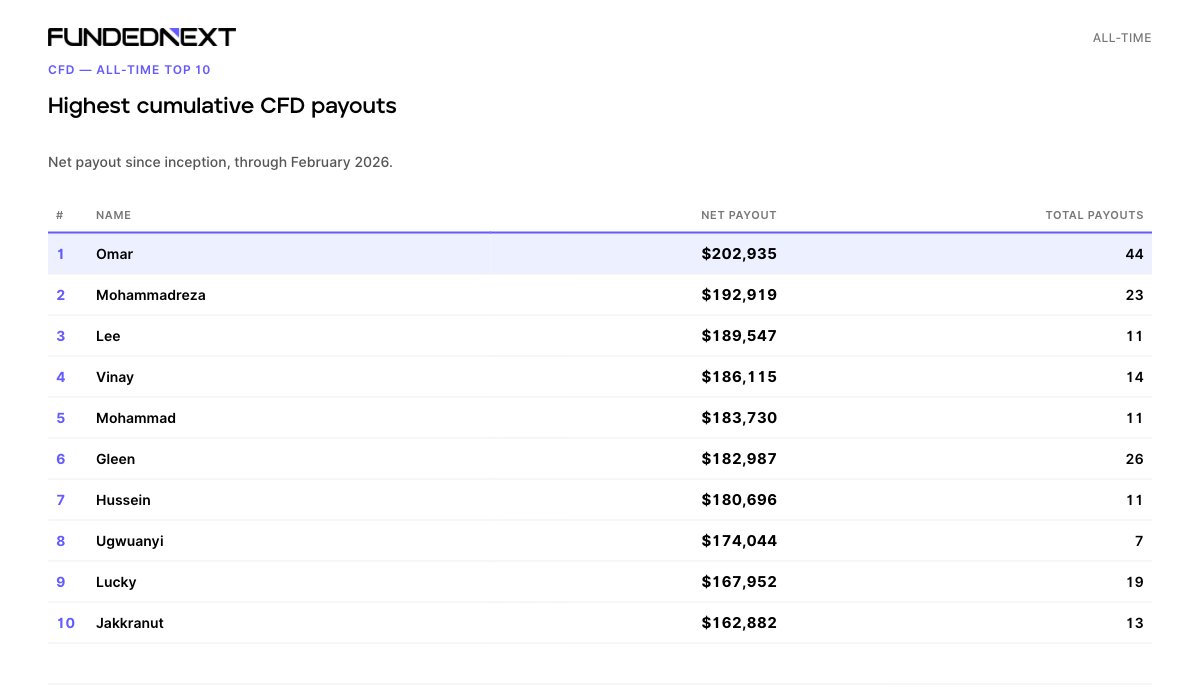
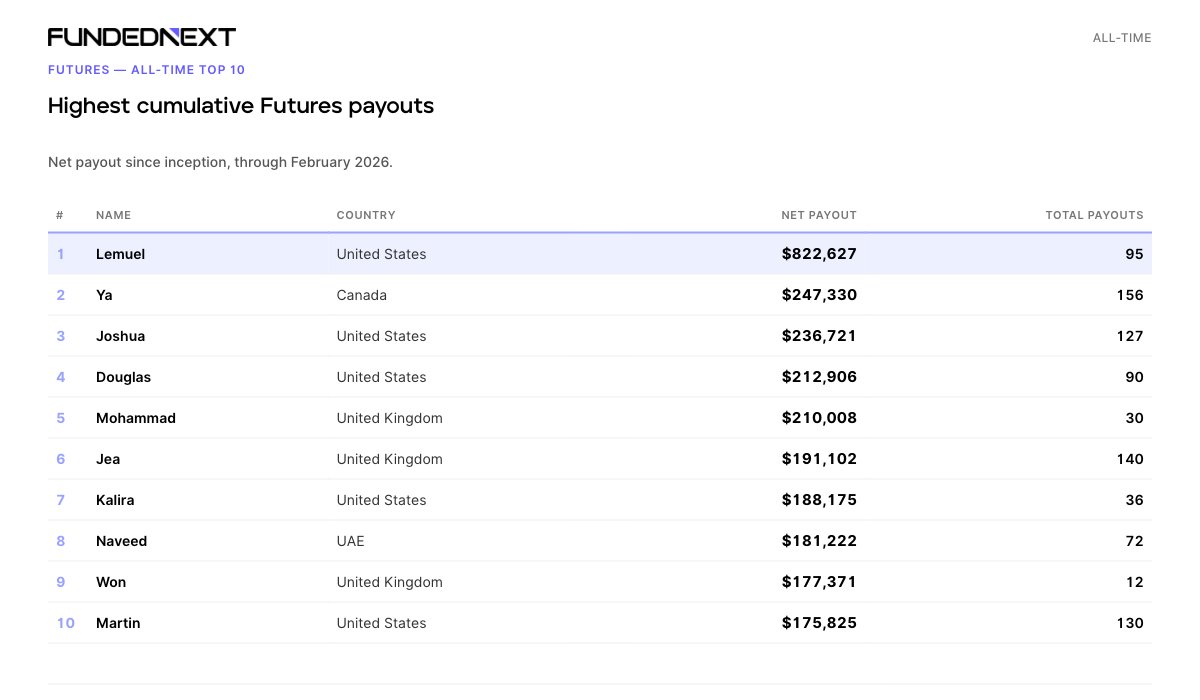
All-Time Highest Cumulative Payouts
These are FundedNext’s highest-paid traders across the full history of the platform, through February 2026, listed separately for CFD and Futures.
CFD — All-Time Top 10
Futures — All-Time Top 10
What Comes Next
$271.4M+ paid to traders since inception. 205,380 transactions processed.
February 2026 was one month of that record. March data will be published next month.
